Markets have started on a slight bull activity today, with the global market cap recording a 0.15% increase within a day as the total cap stands at $1.04T as of press time. The fear and greed index is still at 35, as investor fear looms.
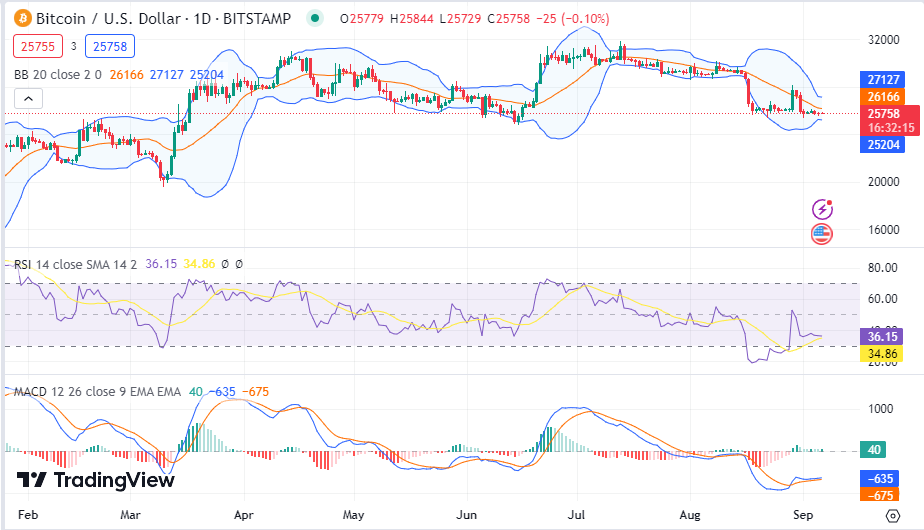
Bitcoin (BTC) analysis
Bitcoin (BTC) has encountered minor bull activity, trading at $25.74K after recording a daily increase of 0.19%, as the weekly drop now stands at 6.1%. Bitcoin’s trade volume jumped by 1.5% during the same period, presently at $10.8B.
The Bollinger bands are now moving close to each other, indicating that the volatility levels of Bitcoin are low. The Relative Strength Index (RSI) is still above its average as bulls and bears fight for dominance. The MACD also moves in the green zone.
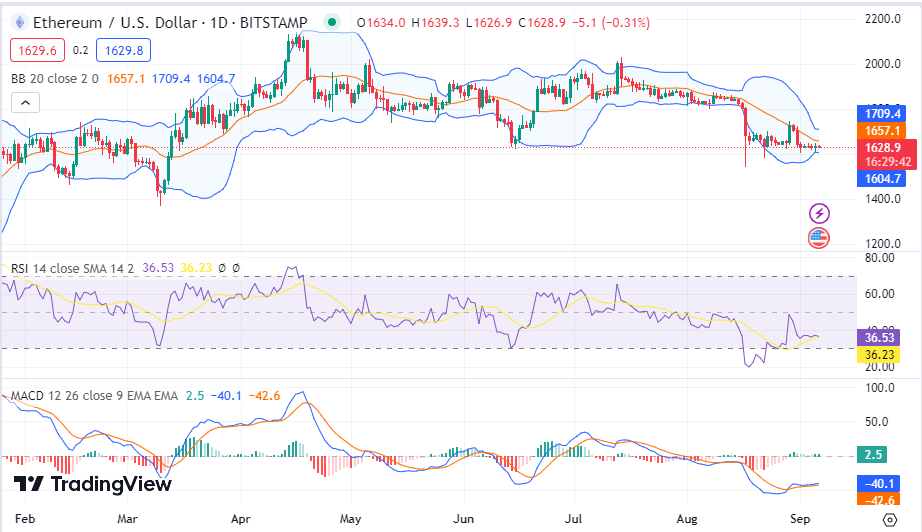
Ethereum (ETH) analysis
Ethereum (ETH) has also started today on mild bull activity, as the asset now sits on gains of 0.39% within a day of trading to take it to $1629 as the trading volume dropped by 6.2% to take it to $4.02B as of press time. ETH’s volatility levels are now low as the Bollinger bands move close to each other.
The RSI indicator is still above the average as bulls struggle to dominate. The MACD indicator also moves close in the green zone.
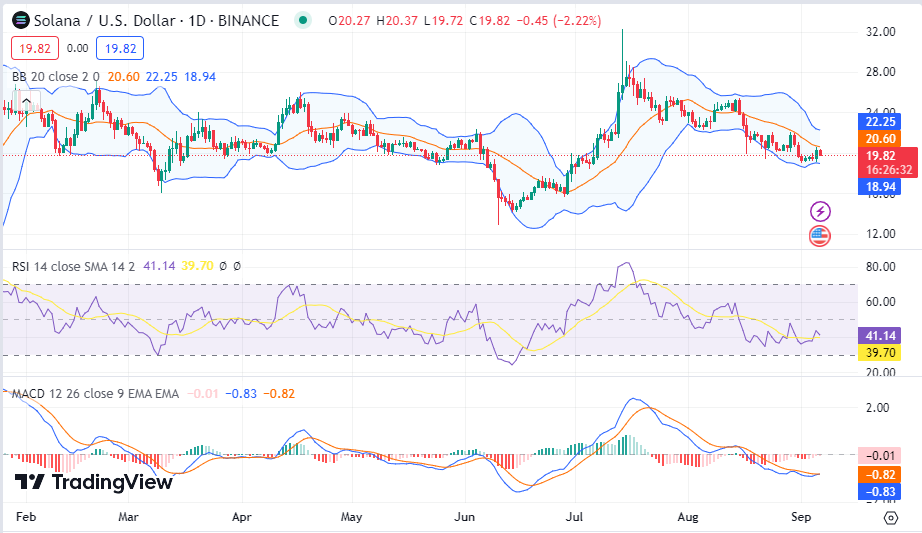
Solana (SOL) analysis
SOL has also started today on bull activity, as the asset now sits on gains of 2.5% within a day of trading to take it to $19.78 as the trading volume jumped by 100% to take it to $404M as of press time. SOL’s volatility levels are now low as the Bollinger bands move close to each other.
The RSI indicator is above the average, showing bull dominance, while the MACD indicator also approaches a shift to the green zone.
Chainlink (LINK) analysis
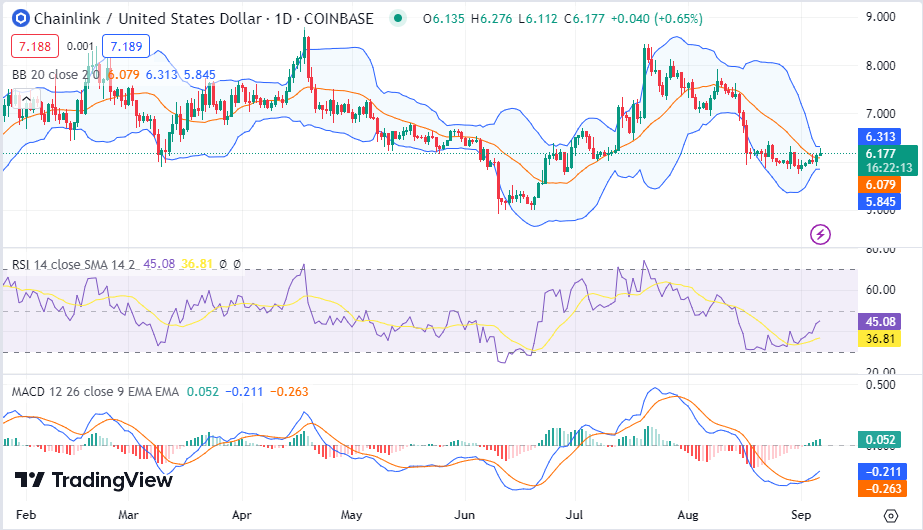
LINK is also sitting on bull activity, as the asset now boasts gains of 3.5% within a day of trading to take it to $6.19, as the trading volume jumped by 14% to take it to $156M as of press time. LINK’s volatility levels are now low as the Bollinger bands move close to each other.
The RSI indicator is above the average, showing bull dominance, while the MACD indicator also moves in the green zone.
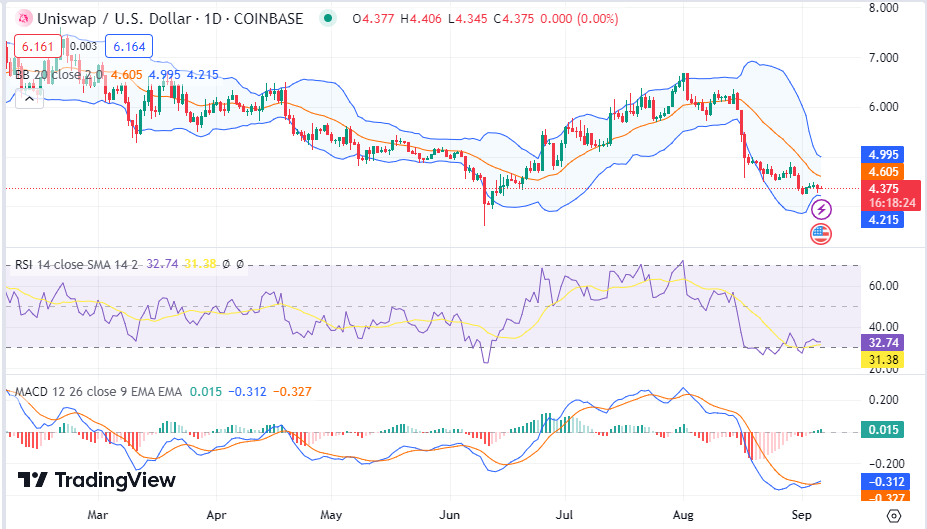
Uniswap (UNI) analysis
UNI is also sitting on bull activity, as the asset now boasts gains of 2.07% within a day of trading to take it to $4.38, and the trading volume jumped by a slight 0.05% to stand at $66M as of press time. UNI’s volatility levels are now low as the Bollinger bands move close to each other.
The RSI indicator is above the average, showing bull dominance, while the MACD indicator also moves in the green zone.
