Crypto betting platform Stake.com suffered a major security breach this Monday, with hackers exploiting vulnerabilities to steal over $41 million from hot wallets across multiple blockchains.
The theft was first detected through blockchain analysis before further investigation revealed the full extent.
As the news unravels about Stake.com's unfortunate security breach, what are the best cryptos to buy now?
The first signs of suspicious activity were detected by blockchain analyst Cyvers, who flagged the unauthorized withdrawal of $15.7 million in ether from Stake's Ethereum wallet.
Further investigation by crypto expert ZachXBT revealed an additional $25.6 million had been drained from the company's Polygon and Binance Smart Chain wallets.
The stolen funds were promptly converted to ether before being dispersed to various external wallet addresses.
While details remain scarce, the evidence overwhelmingly suggests Stake as the hacked entity.
Withdrawals from the platform have been frozen, matching numerous user reports across social media of interrupted services.
Stake, founded in 2017, has rapidly grown into one of the largest crypto casinos globally, reporting annual revenue of $2.6 billion last year.
This latest exploit once again highlights the pressing need to bolster security practices within the crypto sector.
Custodial vulnerabilities have led to billions in lost funds from hacks in 2022 alone. Strengthening risk management protocols and adopting advanced cybersecurity tools will be key to restoring trust and protecting user assets moving forward.
In other industry news, former SEC chair Jay Clayton remains confident the regulatory agency will approve a spot bitcoin ETF despite repeated delays.
The SEC has extended its review period for spot bitcoin ETF applications from several top asset managers. However, Clayton asserts approval is inevitable given existing futures-based products.
The SEC now has until October 7 to make a decision on an application from Global X.
Considering the current economic climate, Rocket Pool, Wall Street Memes, Synthetix, yPredict, and IOTA are some of the best cryptos to buy now thanks to their robust fundamentals and technical upside potential.
Rocket Pool: Trading Volume Soars as Price Retests Resistance Levels

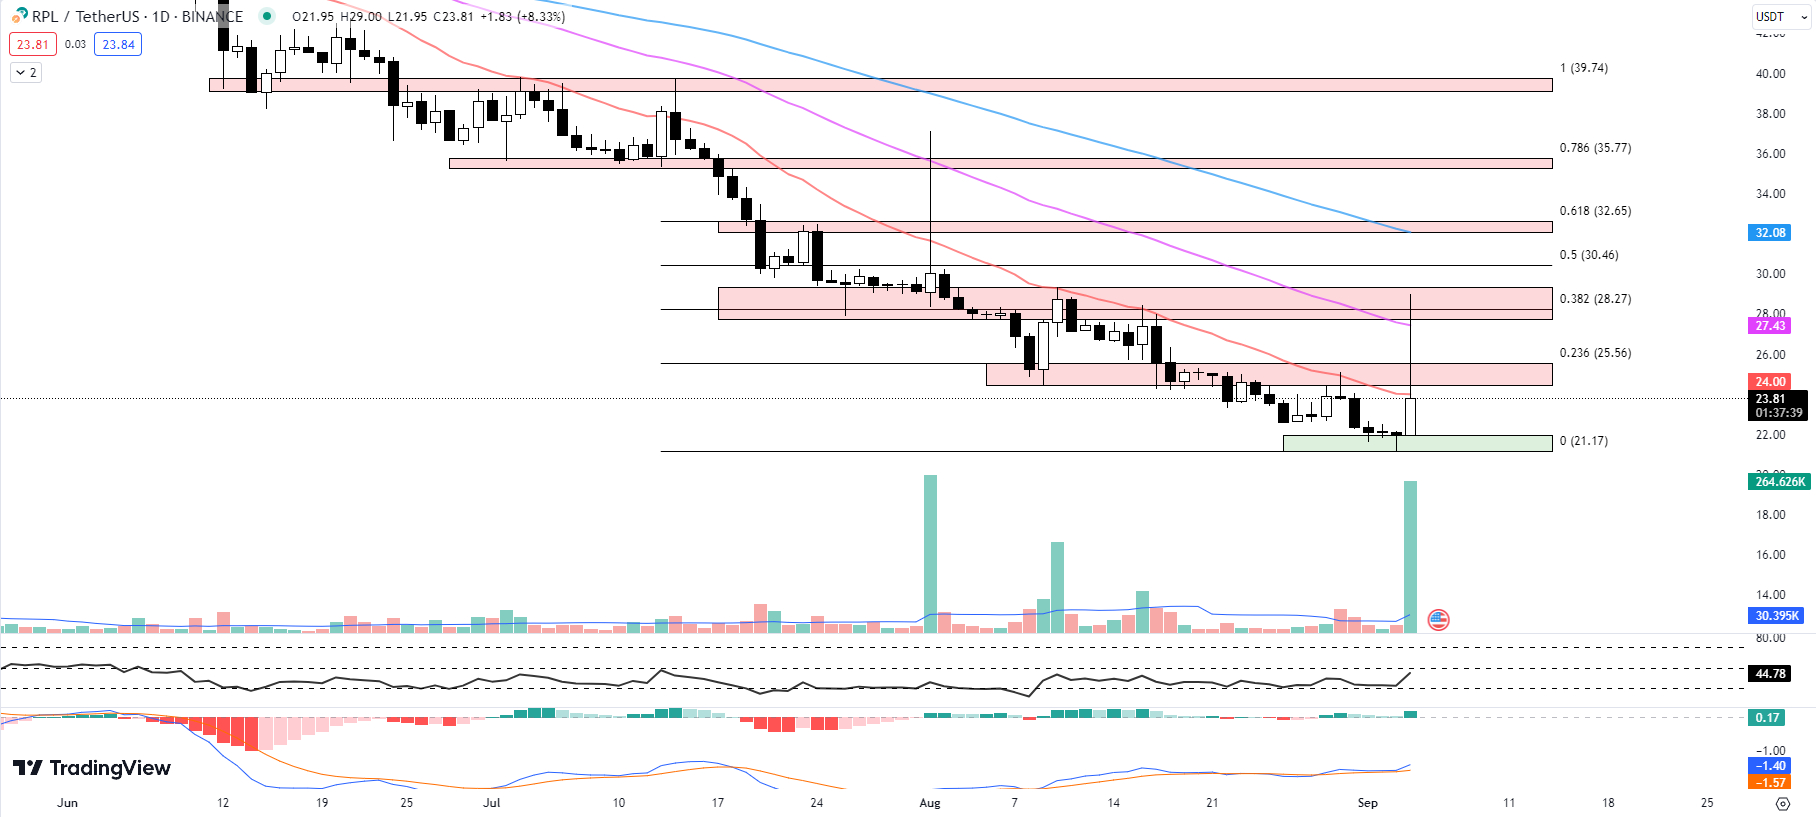
Rocket Pool (RPL) is seeing a lot of trading activity today, with its price currently trading at $23.81, up by 8.33% so far today. Its 24-hour trading volume has seen a substantial increase, reaching $29.5 million.
One possible reason for this uptick might be the news about the Stake.com hack, which has drawn attention to Rocket Pool as an alternative in the crypto space.
Examining the technical indicators for Rocket Pool gives some clues about where the price might go next.
The 20-day, 50-day, and 100-day Exponential Moving Averages (EMAs) are currently at $24, $27.43, and $32.08 respectively.
The 20-day EMA of $24 serves as an immediate resistance level for RPL. Beyond that, there's a horizontal resistance zone ranging from $24.46 to $25.56, which aligns with the Fibonacci 0.236 level at $25.56.
On the downside, immediate support lies in the swing low zone between $21.19 and $21.96.
The RSI has increased from 32.05 yesterday to 44.78 today. Typically, an RSI below 30 is considered oversold, and above 70 is considered overbought. The current RSI suggests that RPL is neither oversold nor overbought at this time.
The MACD histogram has also seen an increase, moving from 0.04 yesterday to 0.17 today. MACD is often used to spot potential reversals in price trends. In this case, the rise in the MACD histogram could signal growing bullish momentum.
Lastly, the market cap has increased by 10.56% to $469.9 million. Combined with the rise in trading volume, this could indicate that RPL is currently in focus among traders.
Given these indicators, traders may want to watch for a potential breakout above the immediate resistance of $24. If the price moves beyond that, the next resistance zone of $24.46 to $25.56 could be the next target.
On the downside, traders may want to look for the price to hold above the swing low support zone of $21.19 to $21.96 as a potential buying area.
Wall Street Memes Gears Up for Public Listing on Major Crypto Exchanges
With over $25 million raised so far, Wall Street Memes is sprinting toward the finish line of its presale funding round and highly anticipated launch on leading cryptocurrency exchanges on September 27.
This successful presale highlights the community's trust in the project and sets the stage for a tier-1 exchange listing later this month.
Wall Street Memes (WSM) is set to go public in 22 days, and the potential for its value to increase has got the investment community excitedly awaiting its market launch.
Wall Street Memes' ability to draw in sizable investments like the $1 million from a sole investor in mid-August bolsters trust in WSM's potential.
This vote of confidence underscores the project's potential in the crypto industry, where advocacy is imperative.
The decision to launch on multiple top-tier exchanges rather than just one underscores the project's credibility.
Opting for premier platforms aligns with Wall Street Memes' ambitions as one of 2023's largest crypto presales at over $25 million raised so far.
WSM's impressive 74% annual percentage yield for staking and multiple payment options add appeal for investors.
The project also boasts a commanding social presence with 40 million monthly impressions and 250,000 Twitter followers, demonstrating its ability to engage the crypto community.
With the backing of its million-strong community, Wall Street Memes' upcoming exchange debut could drive significant expansion for the developing cryptocurrency.
As the presale concludes, WSM tokens remain available at $0.0337 each, presenting a final chance to buy before the listing.
While September has historically seen bearishness in crypto markets, Wall Street Memes looks positioned to buck the trend with its eagerly awaited launch.
With staking rewards, airdrops, and premier exchange visibility, WSM has caught the attention of many as a meme coin to watch.
Synthetix (SNX) Faces Formidable Resistance Level

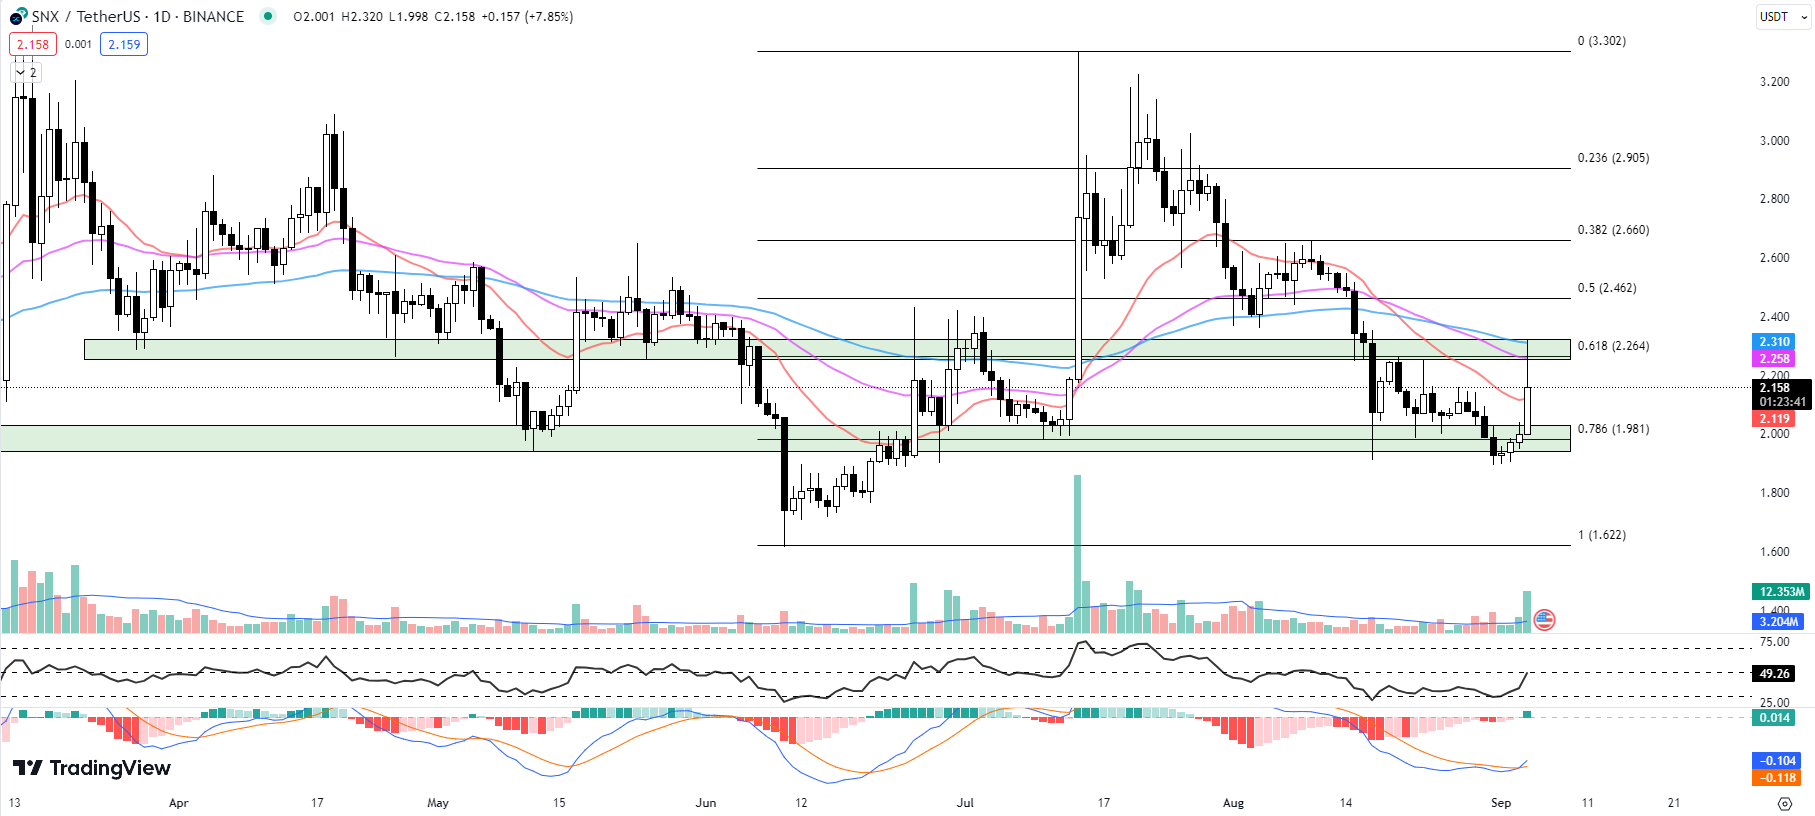
Despite Bitcoin's relatively low volatility, Synthetix (SNX) has seen some price action, as it currently trades at $2.158, up by a 7.85% increase so far today.
The cryptocurrency did soar by nearly 17% at one point but found it hard to pass a significant horizontal resistance zone.
This zone aligns with various other technical indicators, raising questions about the future price movement of SNX.
The 20-day EMA sits at $2.119, below the current price, suggesting short-term support.
However, the 50-day and 100-day EMAs are at $2.258 and $2.310 respectively, indicating that SNX may face resistance ahead.
Meanwhile, the Relative Strength Index (RSI) has risen from 36.77 to 49.26, moving closer to the neutral 50 mark but still not indicating a strong bullish or bearish trend.
The MACD histogram currently shows a value of 0.014, up from yesterday's -0.001, forming a bullish crossover.
This typically signals positive momentum, but given the other mixed signals, it doesn't offer a clear directional cue.
Additionally, market capitalization has increased by 7.83% to $582.5 million, and 24-hour trading volume has surged by 207.87% to $108.1 million.
Both are indicators of increased trader interest.
SNX is facing immediate resistance between $2.255 and $2.323, which is supported by the Fib 0.618 level of $2.264 and the EMAs at $2.119 and $2.258.
On the flip side, immediate support is at the 20-day EMA of $2.119, followed by a more robust horizontal support zone ranging from $1.943 to $2.031, which aligns with the Fib 0.786 level of $1.981.
In the immediate future, traders might want to watch these support and resistance levels closely.
If SNX manages to break the resistance, it could indicate upward movement.
Conversely, if it falls below the support levels, a downward trend could be in the cards.
The mixed signals from the technical indicators suggest a need for caution, and traders might want to wait for more definitive signals before making any moves.
yPredict: Empowering Traders with Real-Time AI Insights; One of the Best Cryptos to Buy Now
The cryptocurrency market is about to gain a powerful new trading analytics tool in yPredict.
This startup seeks to provide real-time AI-powered insights to help traders make more informed investment decisions.
The project, currently in development, has raised over $3.7 million through its $YPRED token presale.
yPredict combines time-tested statistical models like ARIMA with more modern AI technologies including Long Short-Term Memory (LSTM) neural networks.
This allows the platform to analyze historical data to detect patterns and generate insights about potential future price movements.
The company plans to launch a Prediction Marketplace in 2023 that will allow data scientists to monetize their models. Traders can subscribe to quantitative models that fit their trading style.
This seeks to democratize access to predictive analytics beyond major hedge funds.
Additional yPredict products are coming in 2023-2024 including a Repository for historical market data, an Analytics platform for sentiment analysis, and a Terminal for swift trade execution. Each caters to a different need in the trading process.
By integrating both traditional and cutting-edge techniques, yPredict offers traders unique predictive signals and financial forecasting capabilities.
The company intends to make robust analytics available to all market participants, not just institutions.
The company roadmap starts with beta releases of the Repository and Marketplace in Q3 2023. The tools will then be refined based on user feedback before full launches in 2024.
IOTA: Treading Cautiously Amid Bearish Volume Divergence

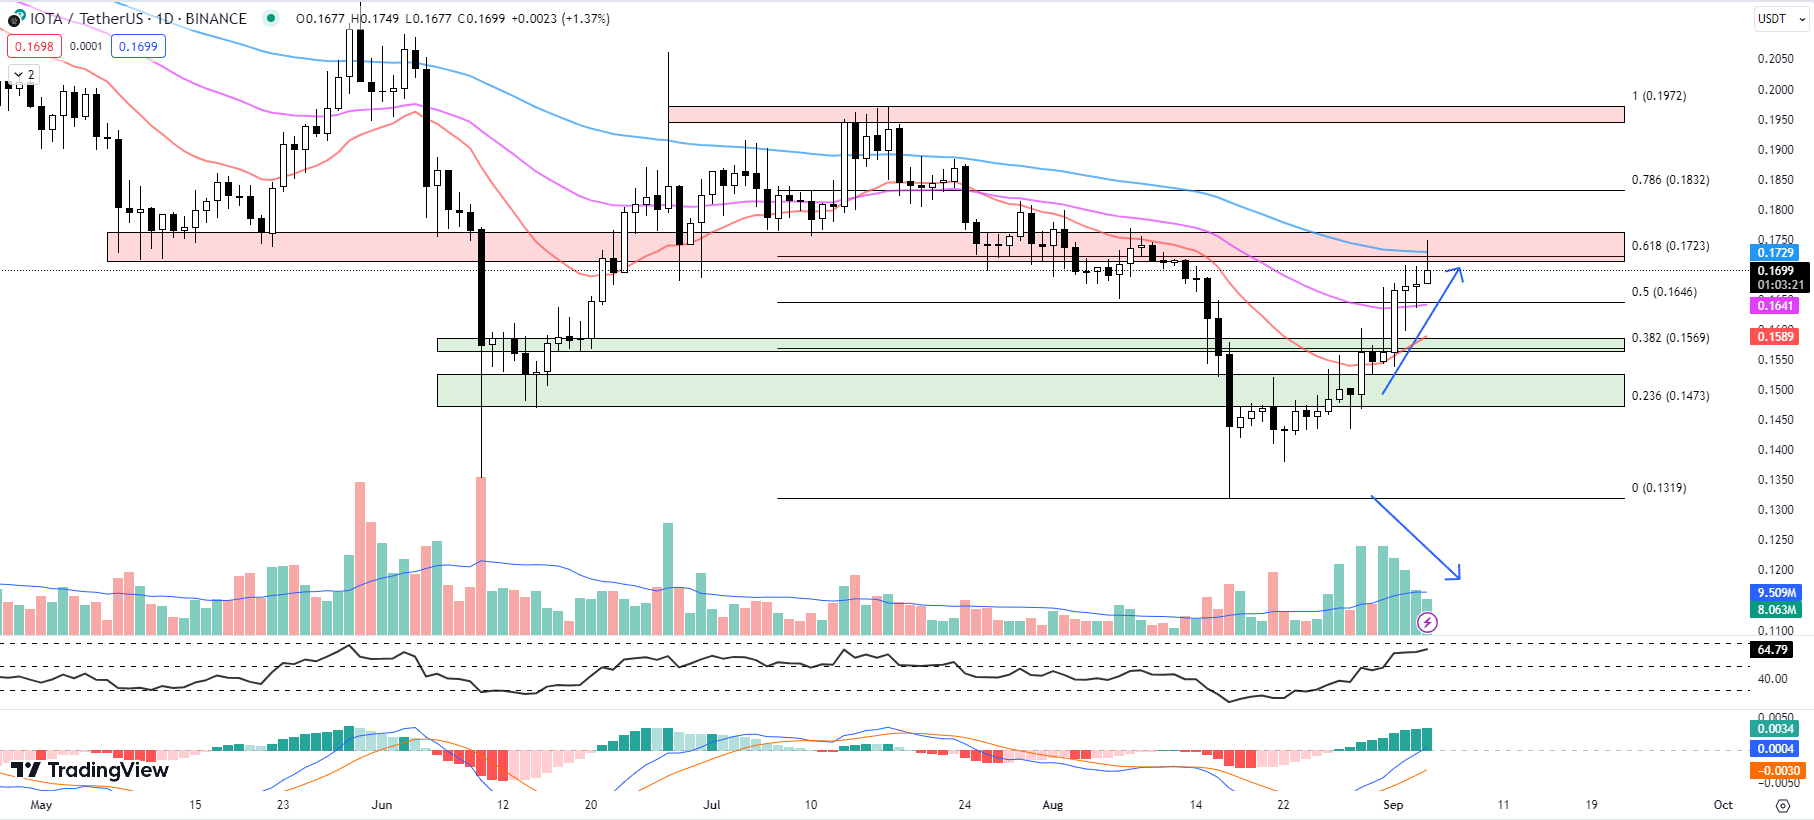
IOTA has generally shown positive price action over the last 12 days. However, traders should keep a close eye on IOTA's price action for the next few days.
With IOTA on the verge of reaching a significant price resistance level, a decline in trading volume has become apparent, indicating a bearish volume divergence.
Traders should approach the situation with caution and exercise careful judgment in their decision-making process.
Regarding the technical indicators for IOTA, the 20-day EMA is at $0.1589, the 50-day EMA is at $0.1641, and the 100-day EMA stands at $0.1729. The RSI has moved up to 64.69 from yesterday's reading of 62.46.
Meanwhile, the MACD histogram has slightly increased to 0.0034 from yesterday’s 0.0033. IOTA is currently at $0.1699 and has risen by 1.37% so far today.
When looking at resistance levels, there is a horizontal resistance ranging from $0.1714 to $0.1762. This range aligns with the Fib 0.618 level at $0.1723 and the 100-day EMA at $0.1729.
Earlier today, IOTA briefly rose to an intraday high of $0.1749 but encountered selling pressure before it could sustain above these levels.
In terms of immediate support, the Fib 0.5 level is at $0.1646 and aligns closely with the 50-day EMA of $0.1641. This support could serve as a fallback if selling pressure continues.
In light of these indicators, traders may want to be cautious. The bearish volume divergence and resistance near the 100-day EMA suggest that IOTA might need more time to consolidate before attempting to move higher.
Therefore, traders should consider monitoring these technical indicators closely for the next course of action.
 cryptonews.com
