Decred (DCR) was launched in 2016. It was created by a group of software developers. Its purpose is to communicate the use of cryptocurrency. This is done by making it difficult to control the flow of this cryptocurrency by a small group of people. Let us look at the technical analysis of DCR.
Past Performance
The past week started for DCR with an opening price of $126.33 on 29 September 2021. The past week witnessed stability in the prices of DCR, and it ended with a closing price of $130.57. This was a 30% change in the price over the past week.
Source: https://www.tradingview.com/x/DSBa70In/
DCR Technical Analysis
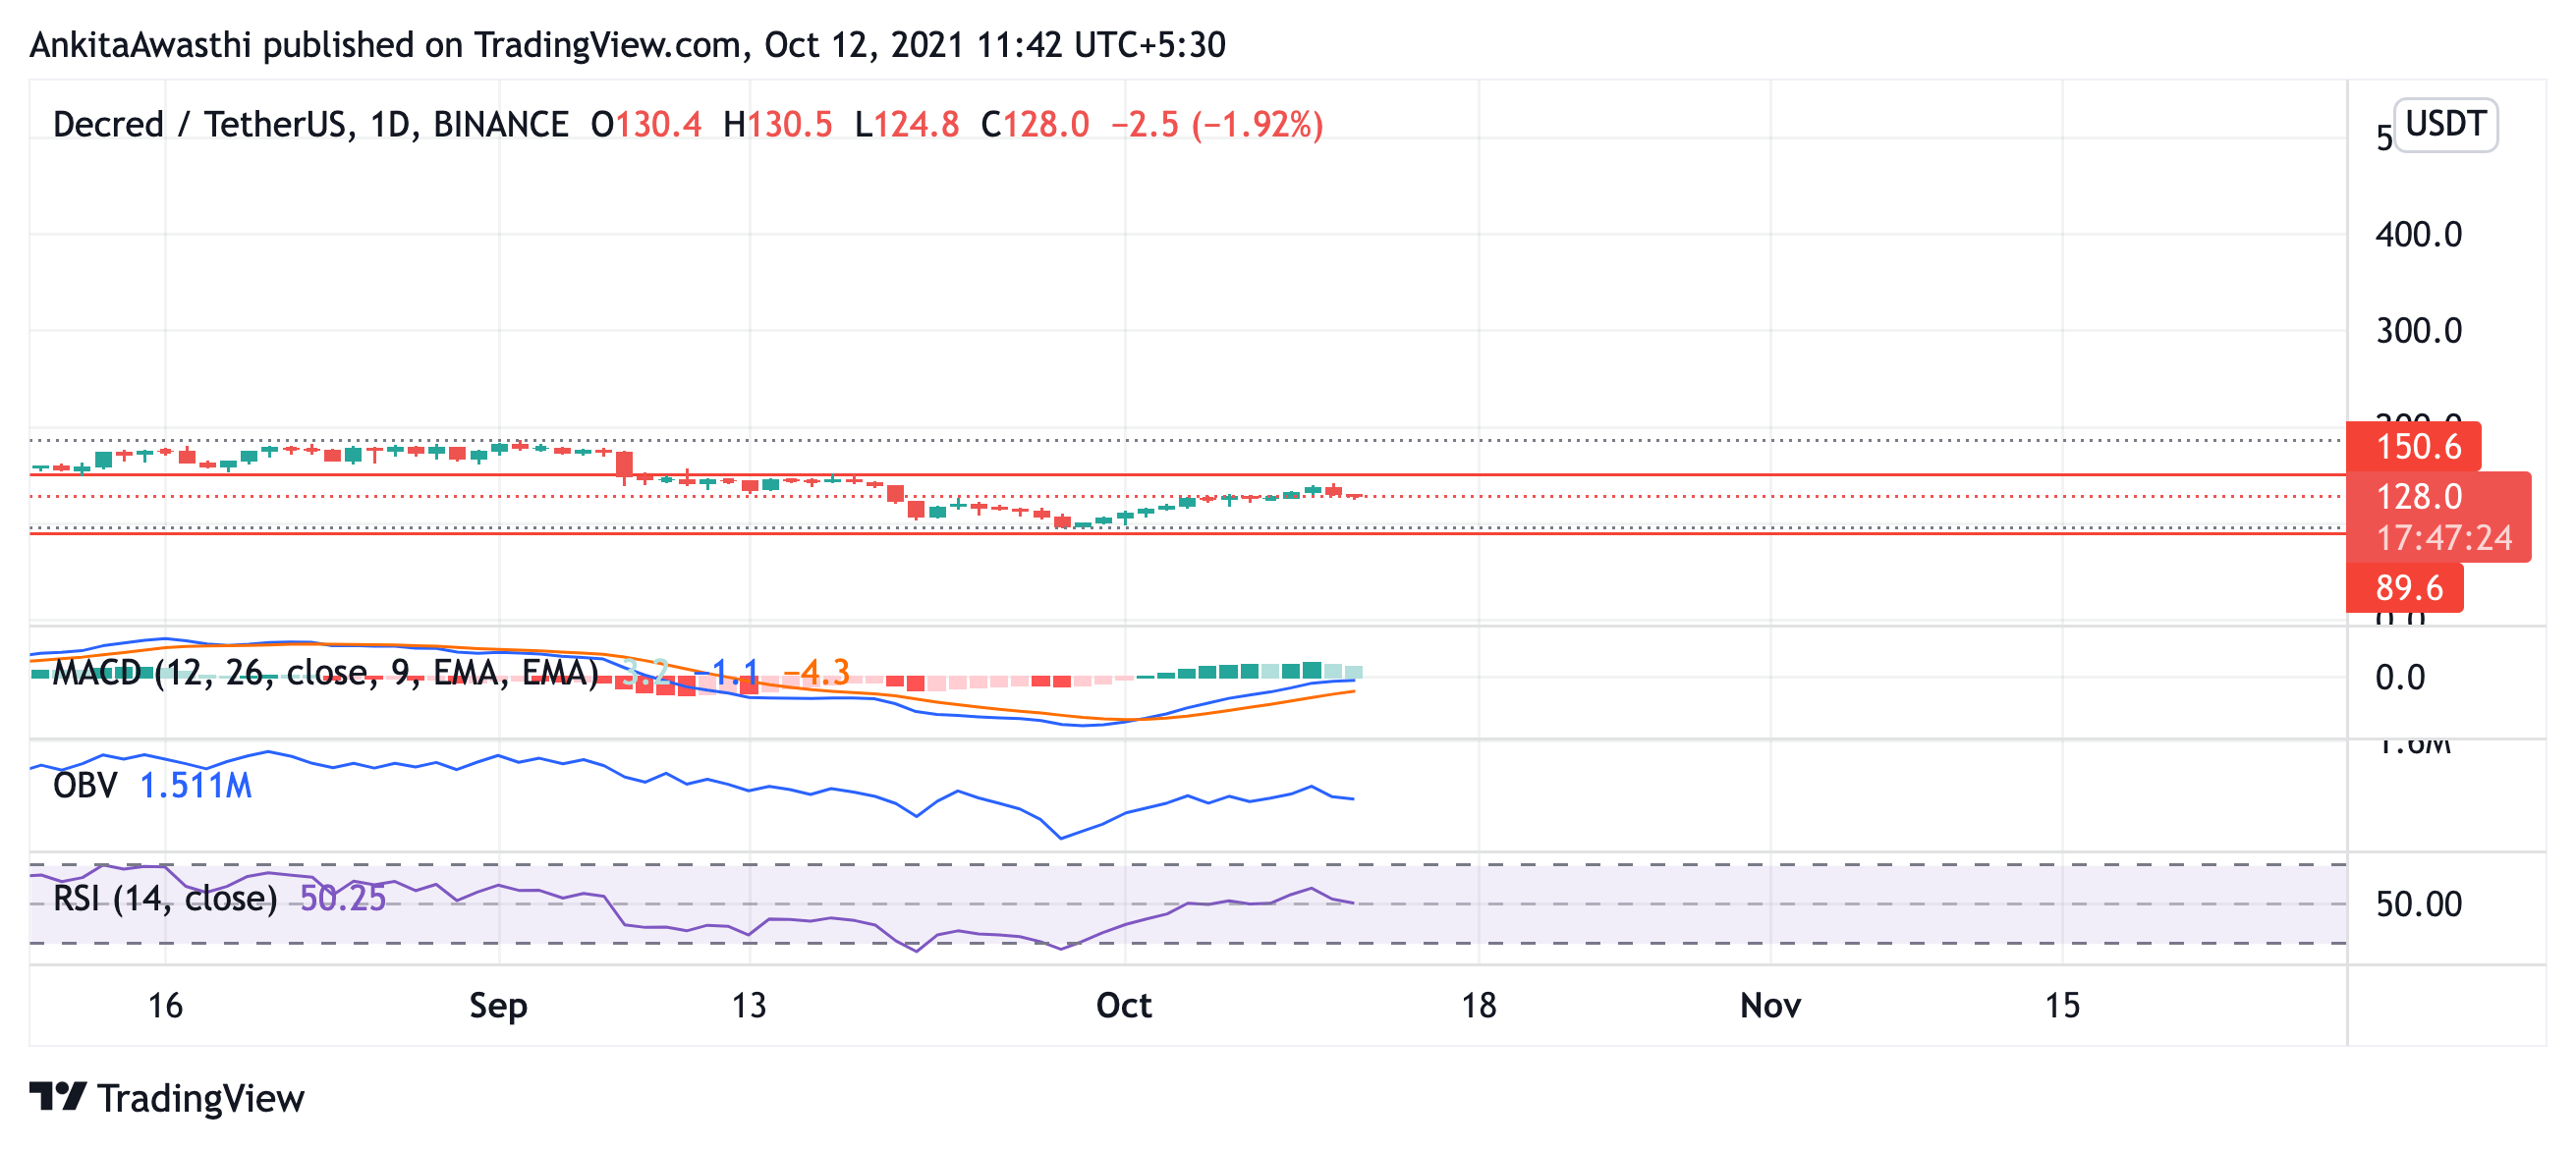
The price is still moving in a box. There has been very low volatility, indicating that the traders need to hold their current positions and wait for a significant deviation.
The current trading is happening at $128, which is down 1.92% in the last 24-hour. The price is less likely to show a strong deviation without a signal.
OBV is showing continuous hills and valleys. This means that the price is oscillating between a range. This is a neutral signal.
RSI is moving close to the equilibrium level. It is currently at 50.25. This is again a neutral signal, meaning that the traders need to hold their current positions.
MACD is showing no divergence here. The fast and slow lines are approaching each other and the gap is reducing, which is again confirming the stability in the prices for the last few days.
Day-Ahead and Tomorrow
Fib retracement shows similar indications. The DCR price is moving between Fibonacci pivots of $116.88 and $140.8.
Thus, the indicators are showing neutral signals. This means that the traders need to hold their current position and wait for the price chart to show some significant deviation before making a clear call.