The first tranche of AR cryptocurrency was created in June 2018 when Arweave was launched. At that time, 55 million AR tokens were created. An additional 11 million AR tokens are scheduled to be gradually released to the computers performing storage services on the network. Let us look at the technical analysis of AR.
Past Performance
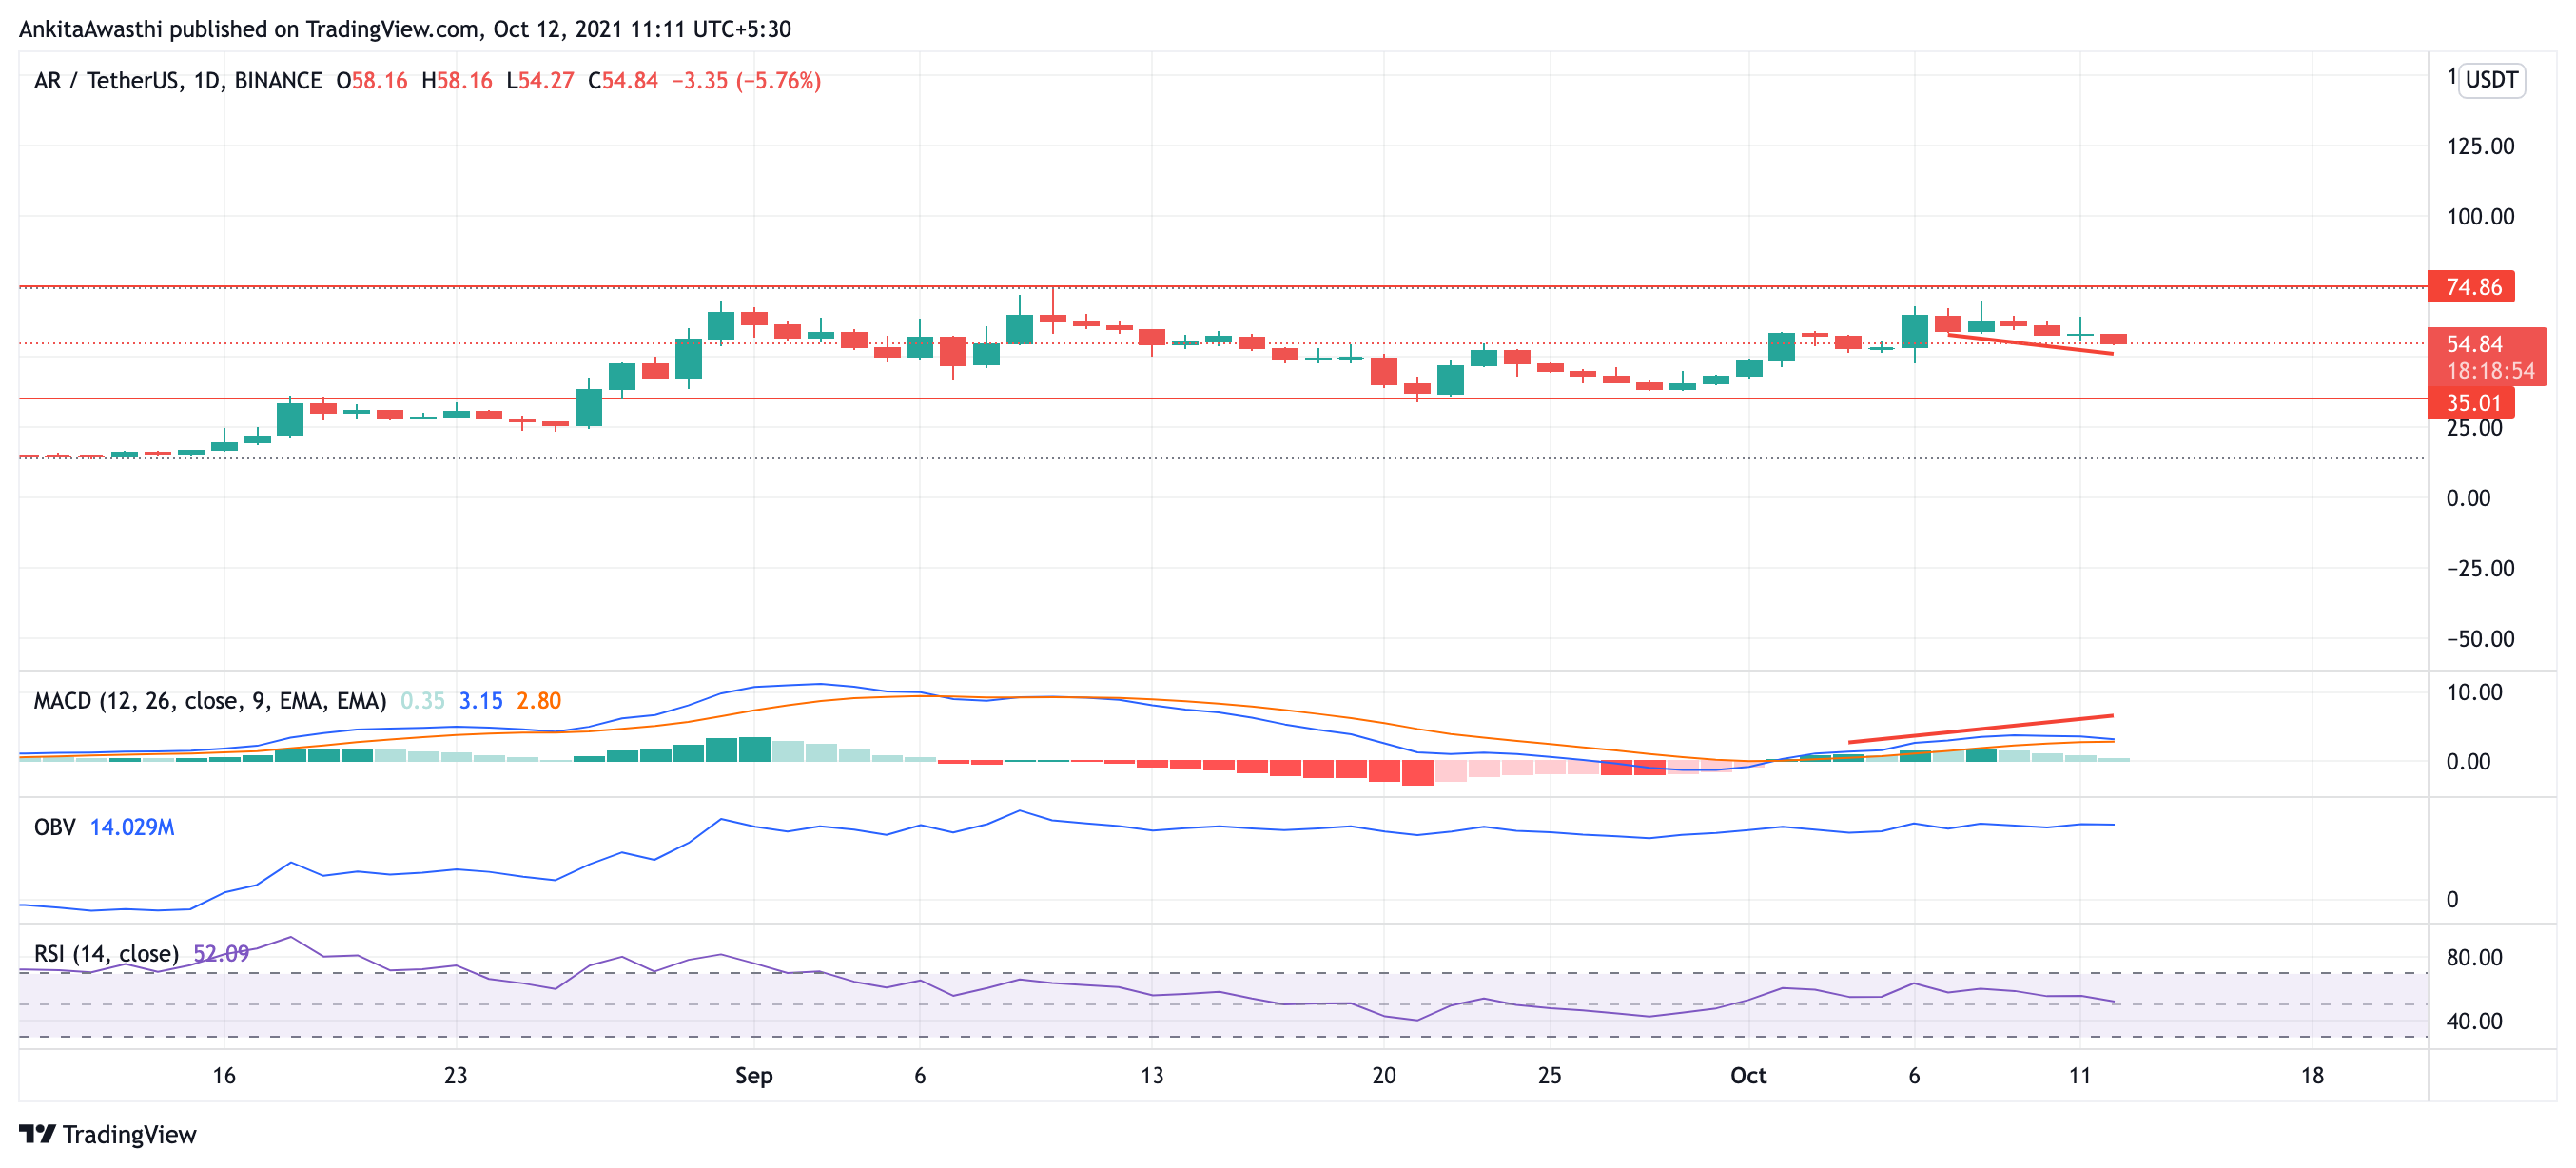
On 5th October 2021, AR opened at $53.08. There was a change of +9.9% across the week, after which it closed at $58.35 on 11 October.
Source: https://www.tradingview.com/x/sOtOAiew/
AR Technical Analysis
The Arweave price is continuing to move inside a box. The upper limit is $74.86 and the lower limit is $54.89. This box is further narrowing.
AR is trading at $54.91, which is 5.64% down from yesterday. It is currently oscillating within a box, and traders may need to hold their position until the price breaks the box.
OBV is going straight, indicating that the buying and selling pressures are balancing each other. This is a neutral sign, which means traders may hold their current positions.
RSI is at 52.14. A slow downtrend can be seen in RSI. This is a signal that the price may break the box to go on a downtrend. If this happens, traders may take a short position. However, we have to wait and watch if the trend reverses.
MACD is showing divergence which the price charts. This is a bullish signal. Traders may take a long position if the trend breaks the box on the upper side.
Day-Ahead and Tomorrow
The fib range for this box is $70-$47.84. The AR price is inside a box in the fib retracement as well.
Thus, the price has entered a box and oscillating between $74.86 and $54.89. Traders may take a short position or a long position depending upon where the trend breaks the box. Until now, the downtrend seems to continue for some more time.