Solana (SOL) bounced on Sept 21, temporarily putting an end to the decrease that had been going on since the Sept 9 all-time high price.
Despite the bounce, the token has yet to confirm its bullish reversal and is possibly still mired in a correction.
SOL drops after all-time high
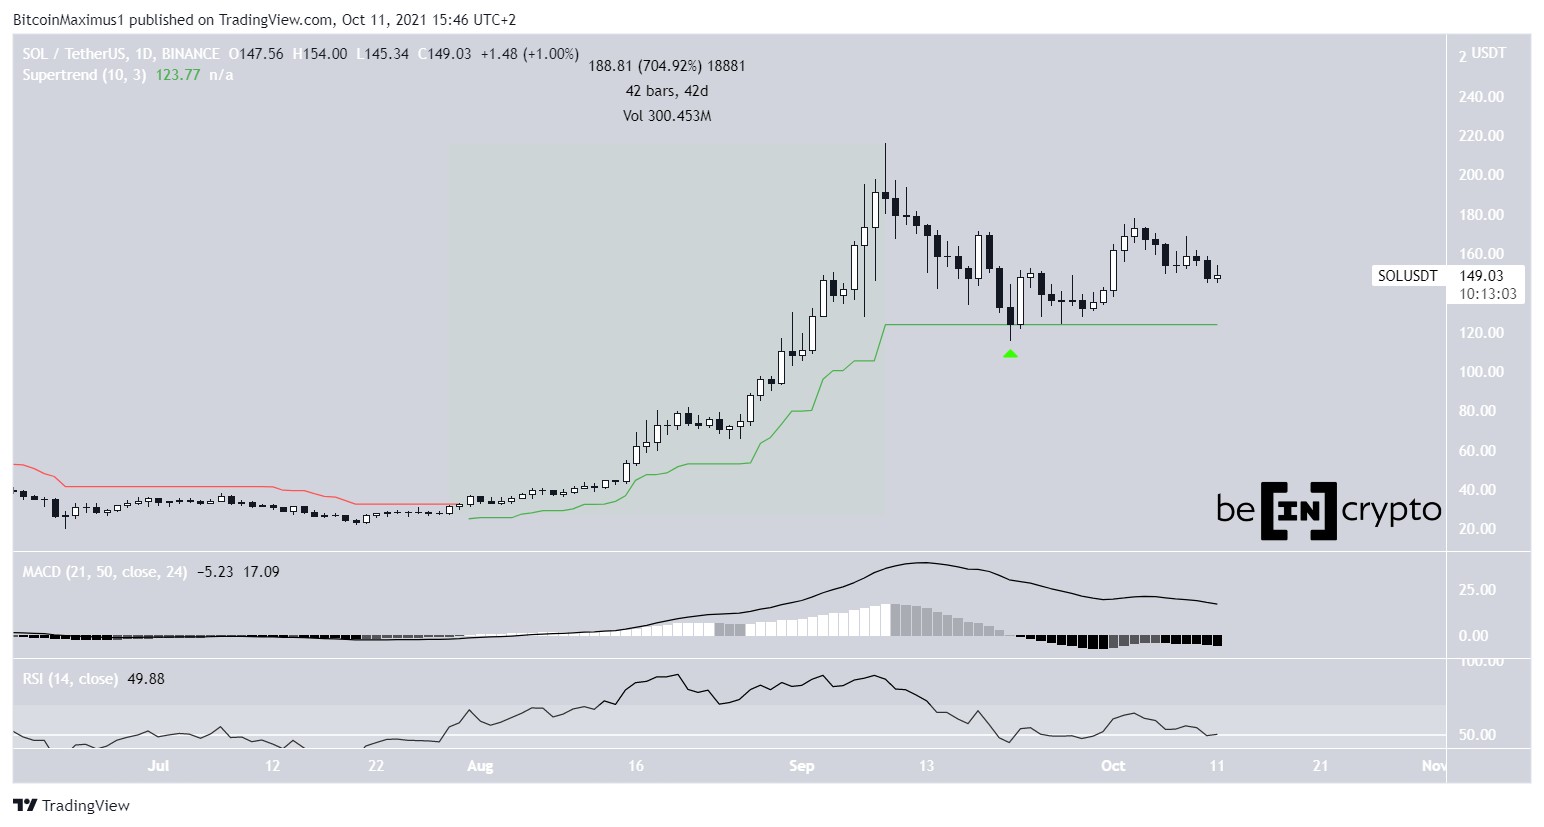
In the period from July 31 to Sept 9, SOL increased by a massive 705%, leading to a new all-time high of $216. However, it created a shooting star candlestick the same day.
The shooting star is a type of bearish candlestick with a long upper wick. It indicates that sellers have taken over due to the considerable selling pressure and often precedes trend reversals. Unsurprisingly, SOL has been moving downwards since.
Technical indicators fail to confirm the direction of the trend.
Firstly, SOL has bounced at the Supertrend line (green icon), which is bullish. The Supertrend is an indicator that shows whether the trend is bullish or bearish. Since the token is above the line, the trend is considered to be bullish.
In addition to this, the MACD is positive. The MACD is an indicator created by a short- and a long-term moving average (MA). The fact that it is positive means that the short-term trend is faster than the long-term one. However, since it is decreasing, it means that the short-term trend is losing ground.
Finally, the RSI is right at the 50 line, which means that the trend is undetermined.
Therefore, the daily time-frame provides conflicting signs as to what is the direction of the trend.
Ongoing Breakout
Cryptocurrency trader @TradingTank outlined a SOL chart, stating that the token is a breakout candidate, since it is in the process of breaking out from a descending resistance line.
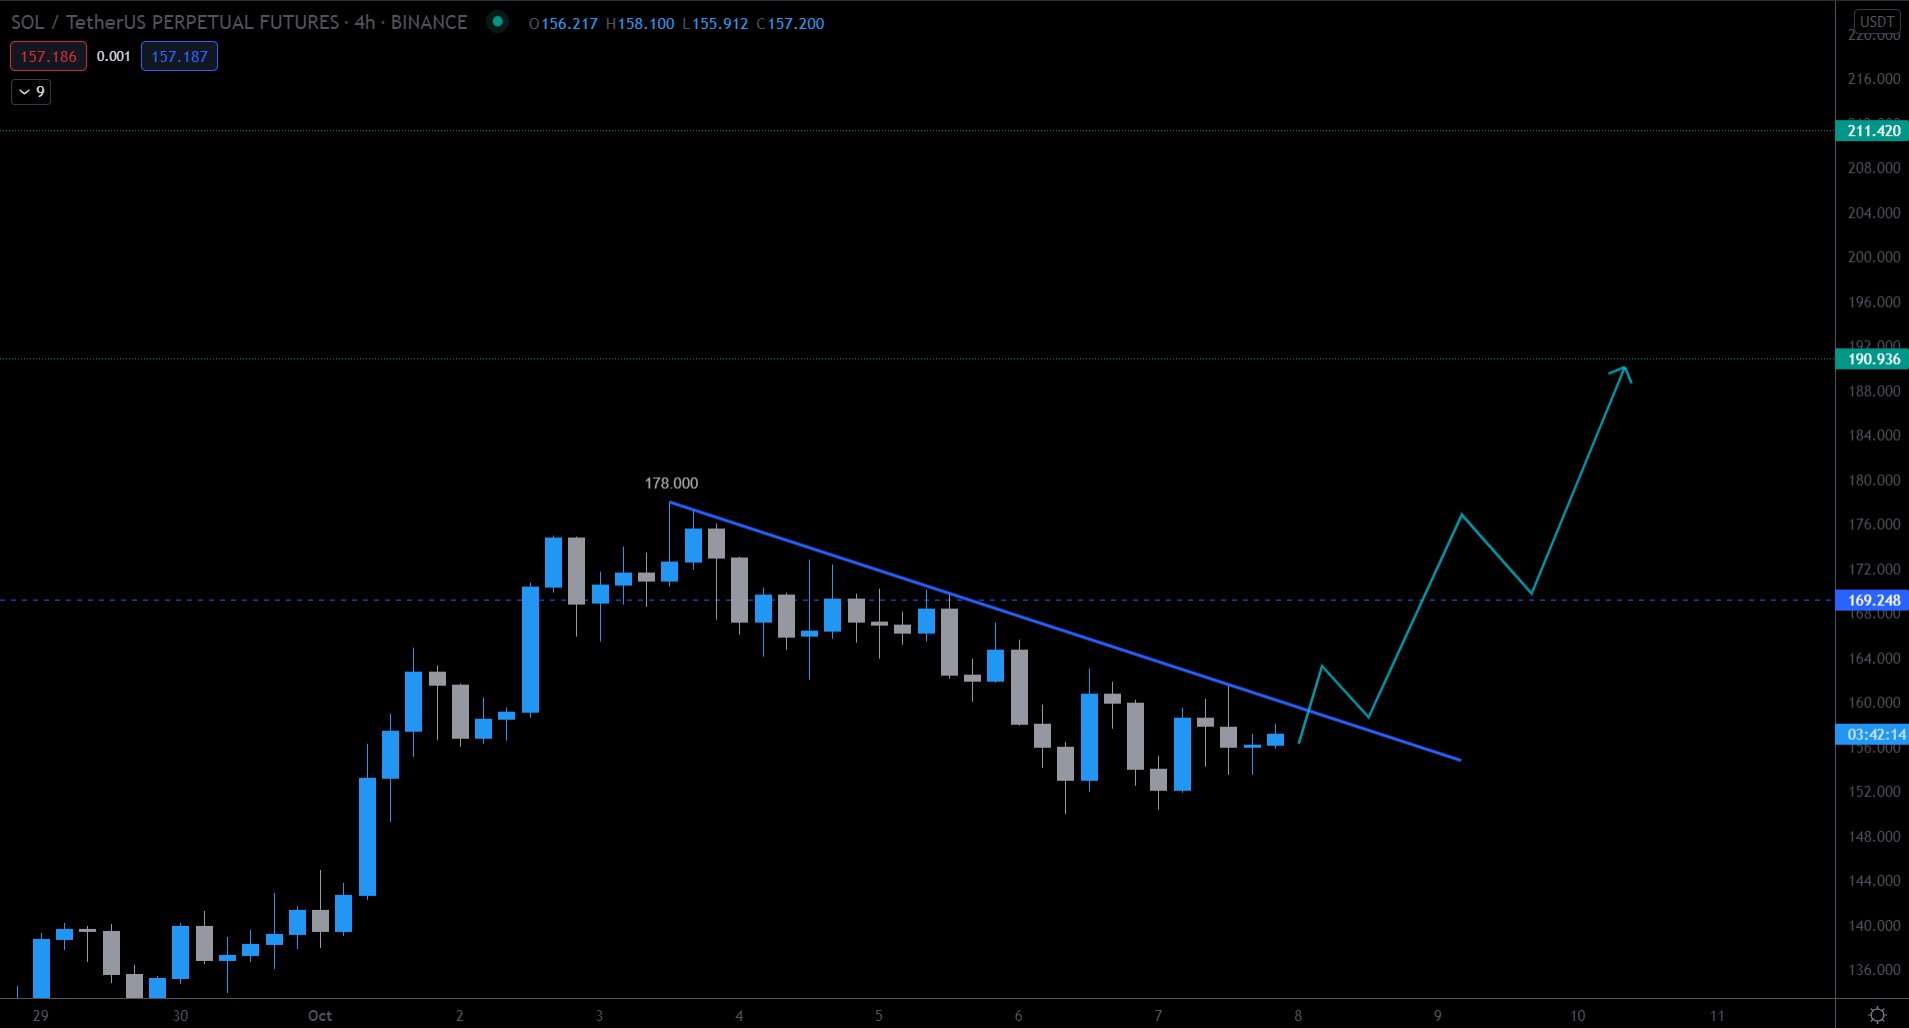
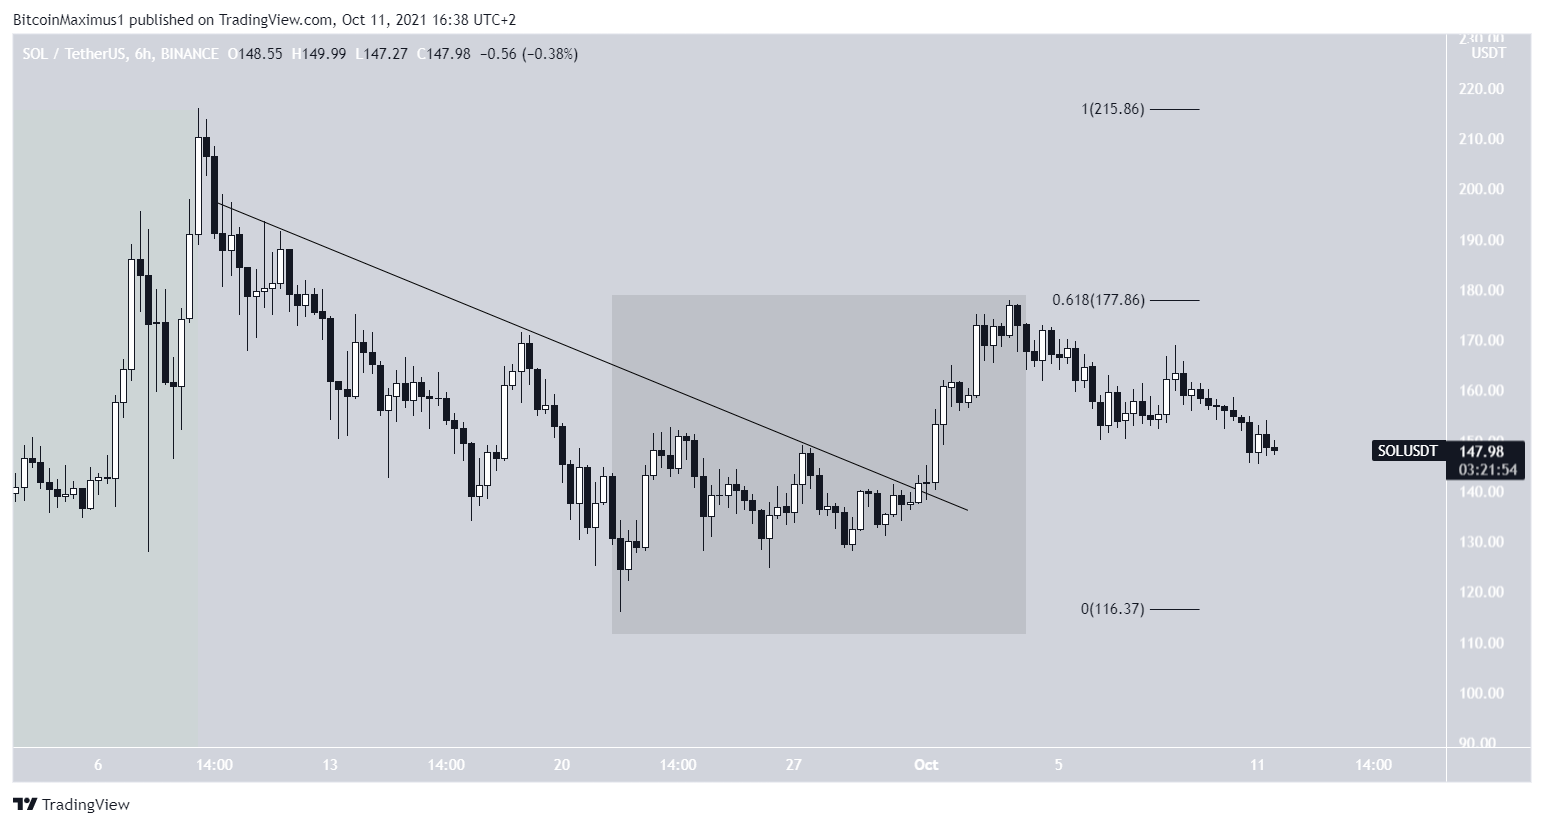
Since the tweet, the token has broken out from the descending resistance line. However, it was rejected by the 0.618 Fib retracement resistance level at $178. This is a very common level for bounces to end.
Furthermore, the upward movement that caused a breakout is a three wave structure (highlighted). If the breakout was the beginning of an upward movement that would take the token towards new highs, we would expect it to be a five wave movement.
Therefore, since it is both a three wave movement and ended at the 0.618 Fib retracement level, the chances are that it is a corrective structure, and the presiding trend is downwards.
Future movement
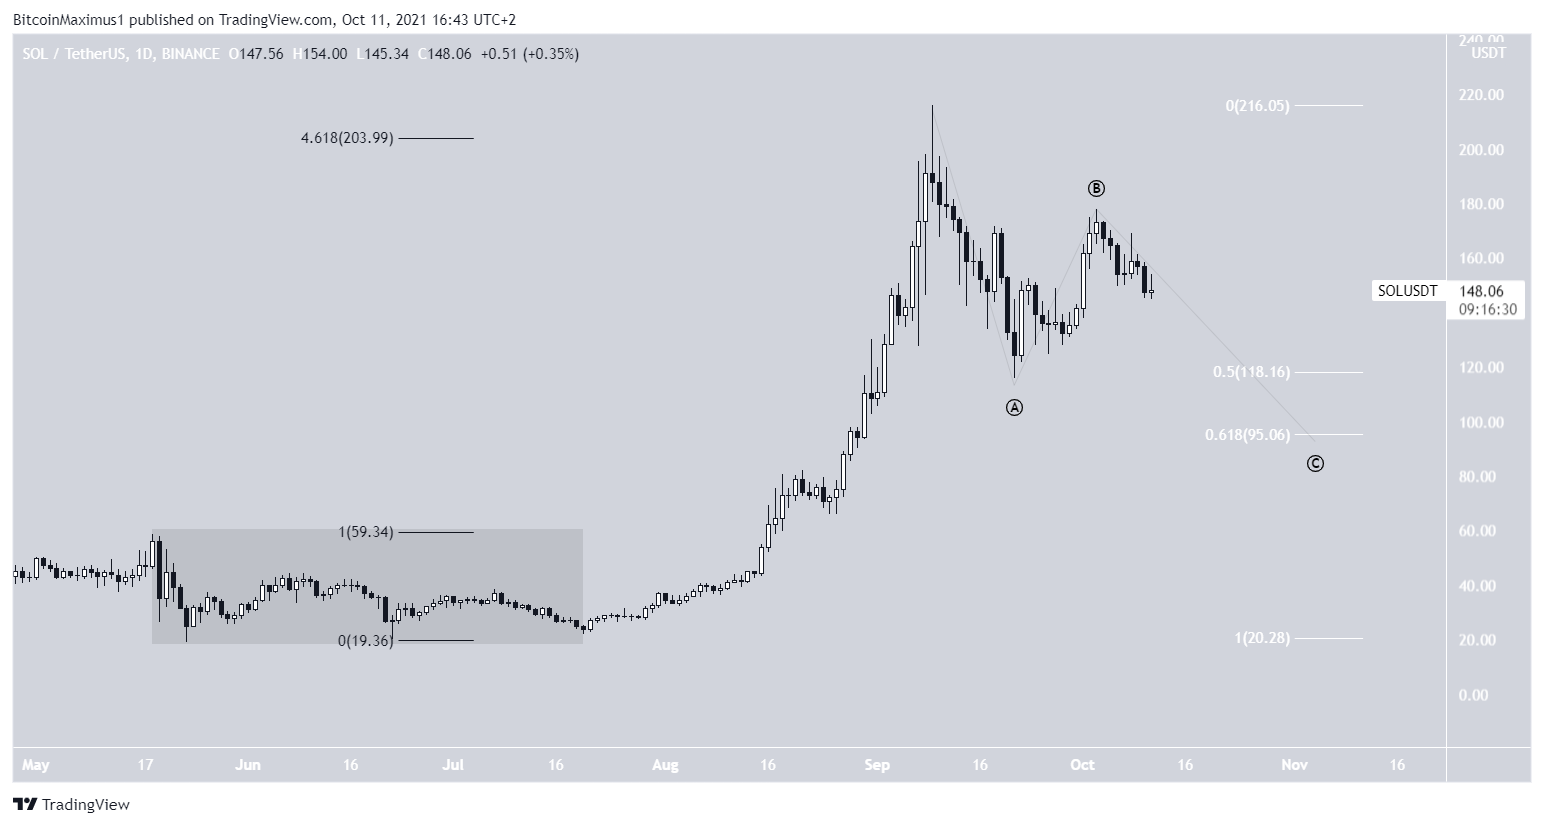
What is immediately noticeable when looking at the SOL movement, is the fact that the all-time high was reached right at the 4.618 external Fib retracement level when measuring the previous drop (highlighted).
This area is considered as the final Fib level when an upward movement extends. Therefore, it is possible that the movement ongoing since June ended with the Sept 9 all-time high.
If correct, SOL is in the C portion of an A-B-C corrective structure, which is the third and final portion of the correction.
The most likely level for it to be complete would be at either the 0.5 or 0.618 Fib retracement support levels (white) at $118 and $95, respectively.