IDEX
This is among the first decentralized exchanges in the world. It is relying on IDEX for governance.
Past Performance of IDEX
The IDEX crypto is one of the top performers, adding seven percent on the last trading day.
As per the IDEX technical analysis, buyers are back after days of lower lows versus the greenback.
Day-Ahead and What to Expect
Overall, the token prices are realigned with gains of late September 2021.
Despite the recent contraction of IDEX coin prices, the token is now trading in a bullish breakout pattern clearing above the middle BB.
From this alignment, the odds of bulls driving prices towards $0.45 and later $1.65 in the medium-term remain high.
IDEX Technical Analysis
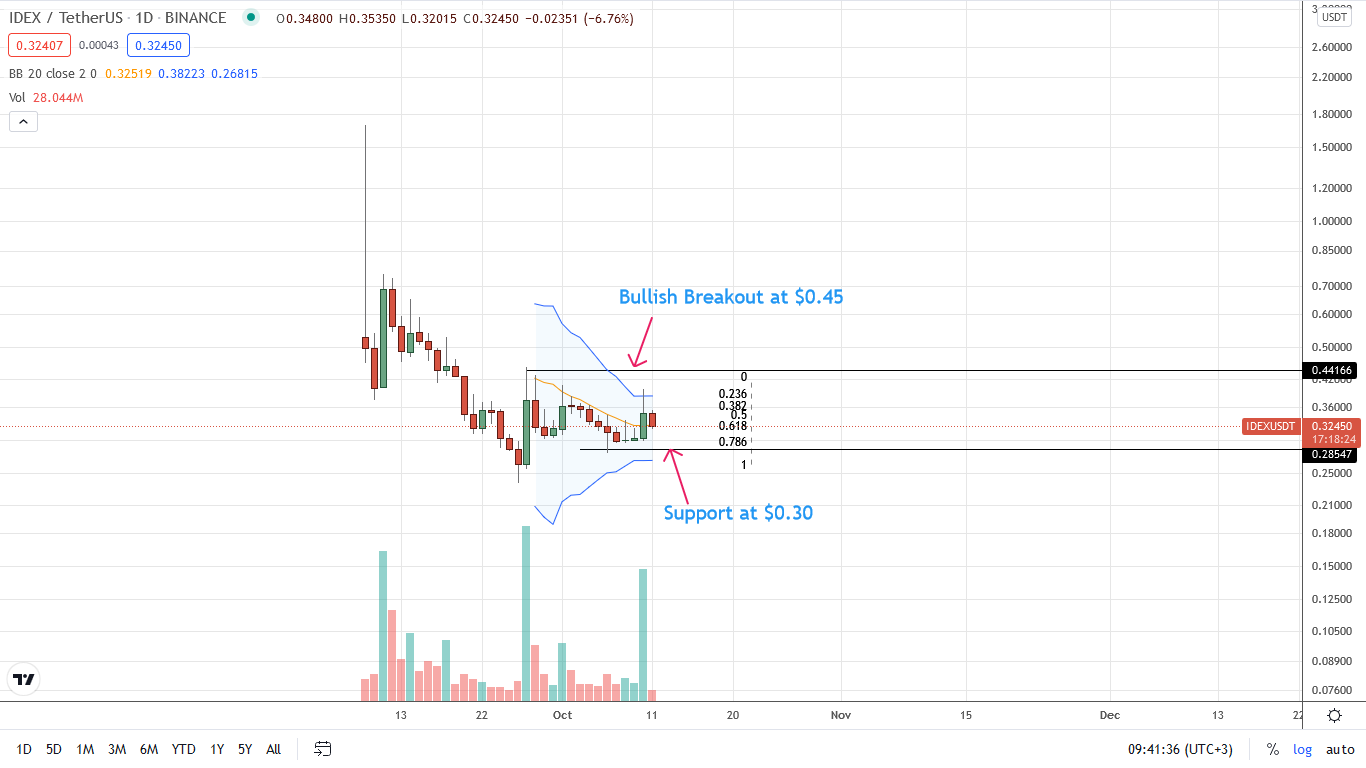
The IDEX price is within a bullish breakout pattern, as mentioned earlier.
As per the candlestick arrangement, every low may present a loading opportunity as long as prices remain above $0.30 and the 78.6 percent Fibonacci retracement of the September 27 bull bar.
Also, since IDEX prices are within the wide-ranging bull bar, buyers have the upper hand. The immediate term targets remain at $0.45 and later $1.65 if bulls flow back.
UMA Protocol
The platform allows for the creation of synthetic assets on Ethereum using UMA for governance.
Past Performance of UMA
The UMA crypto is down seven percent on the last trading day versus the greenback.
Still, as per the UMA technical analysis, buyers have the upper hand.
Day-Ahead and What to Expect
Buyers are confident about what lies ahead as per the candlestick arrangement in the daily chart.
With bulls taking charge, every low may offer entries for aggressive UMA coin traders.
The immediate target lies at $15—August 2021 highs.
On the flip side, the uptrend would be slowed down if sellers flow back, forcing the UMA coin below the middle BB at $9.
UMA Technical Analysis
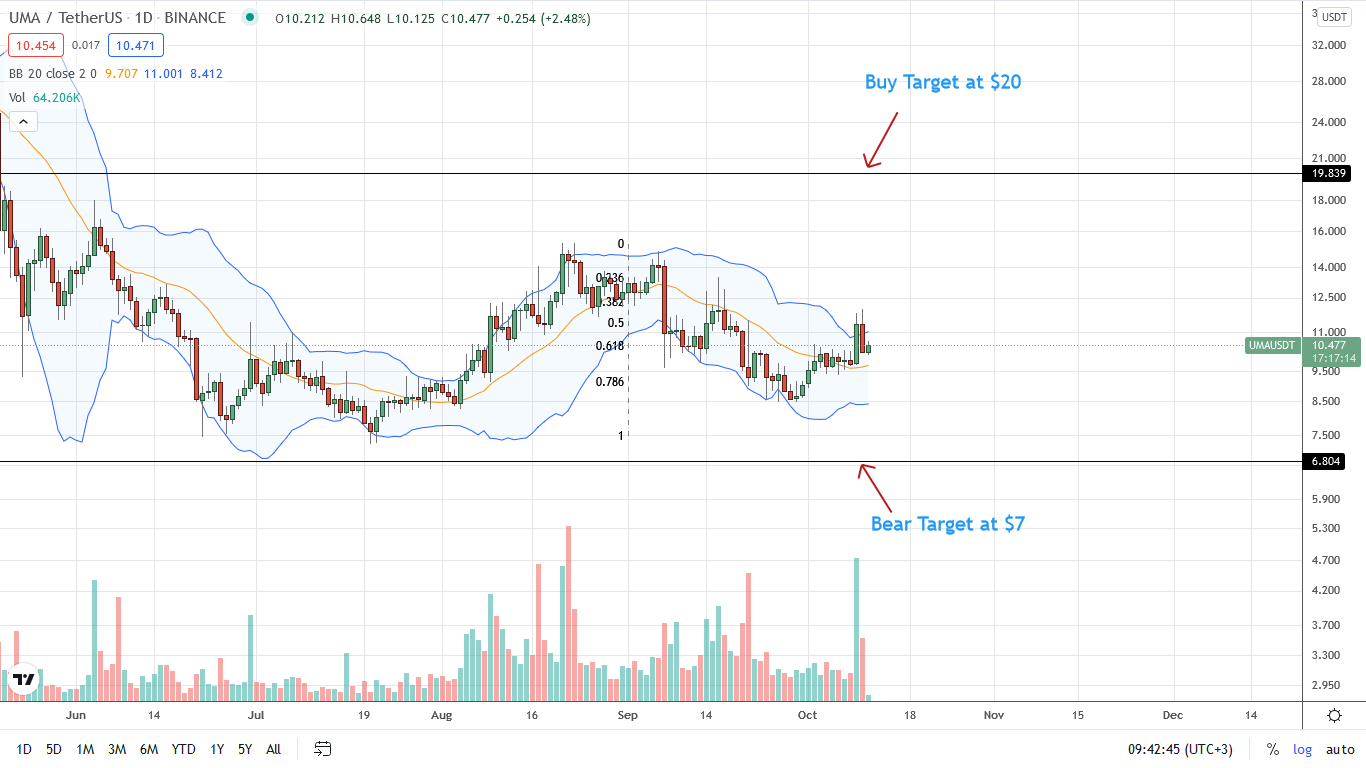
The price is firm despite losses and may expand even further going forward.
Nonetheless, this depends on trading volumes, which ought to confirm gains of October 10 now that UMA is within a bullish breakout pattern.
A follow-through would be the basis for a swing higher towards $15 in a buy trend continuation pattern.
On the flip side, losses below $9 and the middle BB cancel the uptrend.