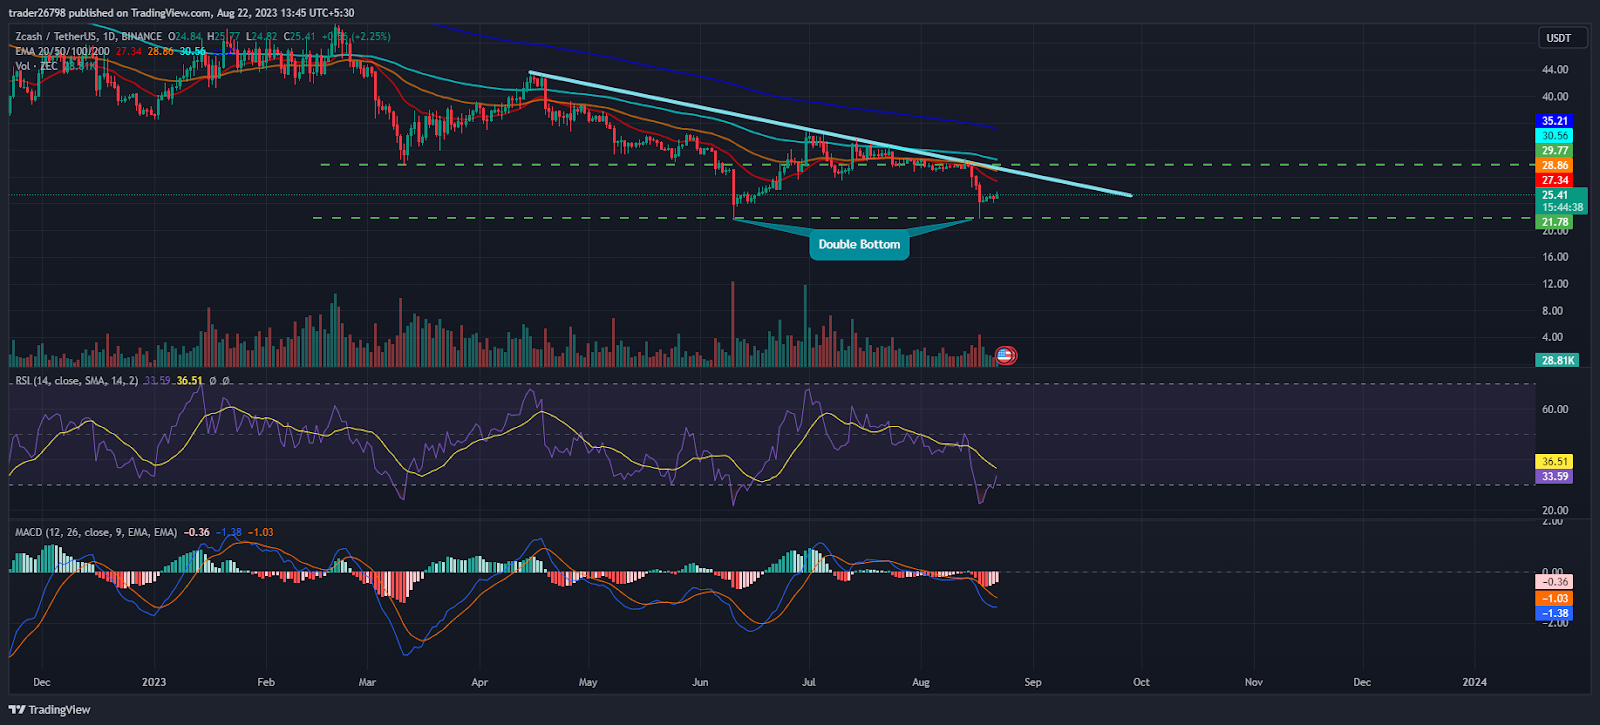
- 1 $ZEC price showed a fall and retested the demand zone near $20.
- 2 Buyers are attempting a reversal and looking to retest the 20-day EMA.
Zcash ($ZEC) price made a double bottom near $21, formed a rejection candlestick, and showed a bounce. Moreover, $ZEC shows signs of trend reversal now and is looking to fetch the 20-day EMA. However, the small size of candles formed in the last session shows the lower interest of investors with average volume, which signals that bears are still active and trying for further fall to break the swing of $20.
However, $ZEC price trading was in a downtrend, and the upper trendline acted as resistance and faced rejection multiple times, resulting in lower lows formation and dragging the gains. Furthermore, the price action favors the bears and signals buyers are worried now. Meanwhile, sellers have persisted in making short positions and are willing to break the immediate support of $20.
$ZEC price is trading below the key moving averages and showing bearishness on the charts. However, buyers managed to absorb the selling pressure and made a double bottom pattern near $20, whose neckline is near $27; if it surpasses leads to a short-term bounce toward $30. Conversely, if follow-on selling arises, it will lead to a revisit of $20.
At press time, $ZEC price is trading at $25.41 with an intraday gain of 2.25%, showing neutrality on the charts. Moreover, the trading volume increased by 10.28% to $8.19 Million, and the pair of $ZEC/$BTC is at 0.0000054 $BTC. However, $ZEC has a market cap of $345.99 Million. Analysts maintained a sell rating and underperform signal for the upcoming sessions.
Will $ZEC Retain The 20-Day EMA?
 $ZEC) Made Double Bottom Near $20, Will It Revisit $30?">
$ZEC price managed to hold the gains near $20 and revamped in the past sessions, forming a double bottom pattern that signals a trend reversal, but it is only valid if the price surpasses $28.
Moreover, buyers are challenged to surpass the upper trendline to flip the trend and attain gains. Furthermore, $ZEC trades near the 23.6% Fib level, which shows a negative outlook on the charts.
The RSI curve stayed in the oversold region and showed a bearish divergence suggesting a downtrend on the charts. Moreover, if the price cannot sustain near $25, it leads to revisiting the $20 and below trajectory toward $15 for the following sessions.
The MACD indicator showed a bearish crossover, and the red bars on the histogram suggest bear dominance on the charts.
Conclusion
$ZEC price shows a downtrend and trades below the significant moving averages, indicating bear dominance on the charts. However, the chart shows a double bottom pattern which signals a reversal, but bears have attained strength and did not exit the cluster near $25, which reacts as a hurdle to surpass.
Technical Levels:
Support Levels: $21 and $18
Resistance Levels:$28 and $30
Disclaimer
The views and opinions stated by the author, or any people named in this article, are for informational purposes only and do not establish financial, investment, or other advice. Investing in or trading crypto assets comes with a risk of financial loss.
 thecoinrepublic.com
