The global cryptocurrency market cap slipped 0.25% over the past 24 hours, according to CoinMarketCap. Consequently, the market’s collective value stood at approximately $1.05 trillion at press time. During this period, Curve DAO Token (CRV), Avalanche (AVAX), Polygon (MATIC), Shiba Inu (SHIB), and ApeCoin (APE) suffered the biggest losses.
Curve DAO Token (CRV)
At press time, CRV was changing hands at $0.4707. This was after the altcoin recorded the biggest 24-hour loss of 4.77%. The latest decrease in CRV’s price meant it was trading closer to its 24-hour low of $0.4677, while its daily high stood at $0.4954.
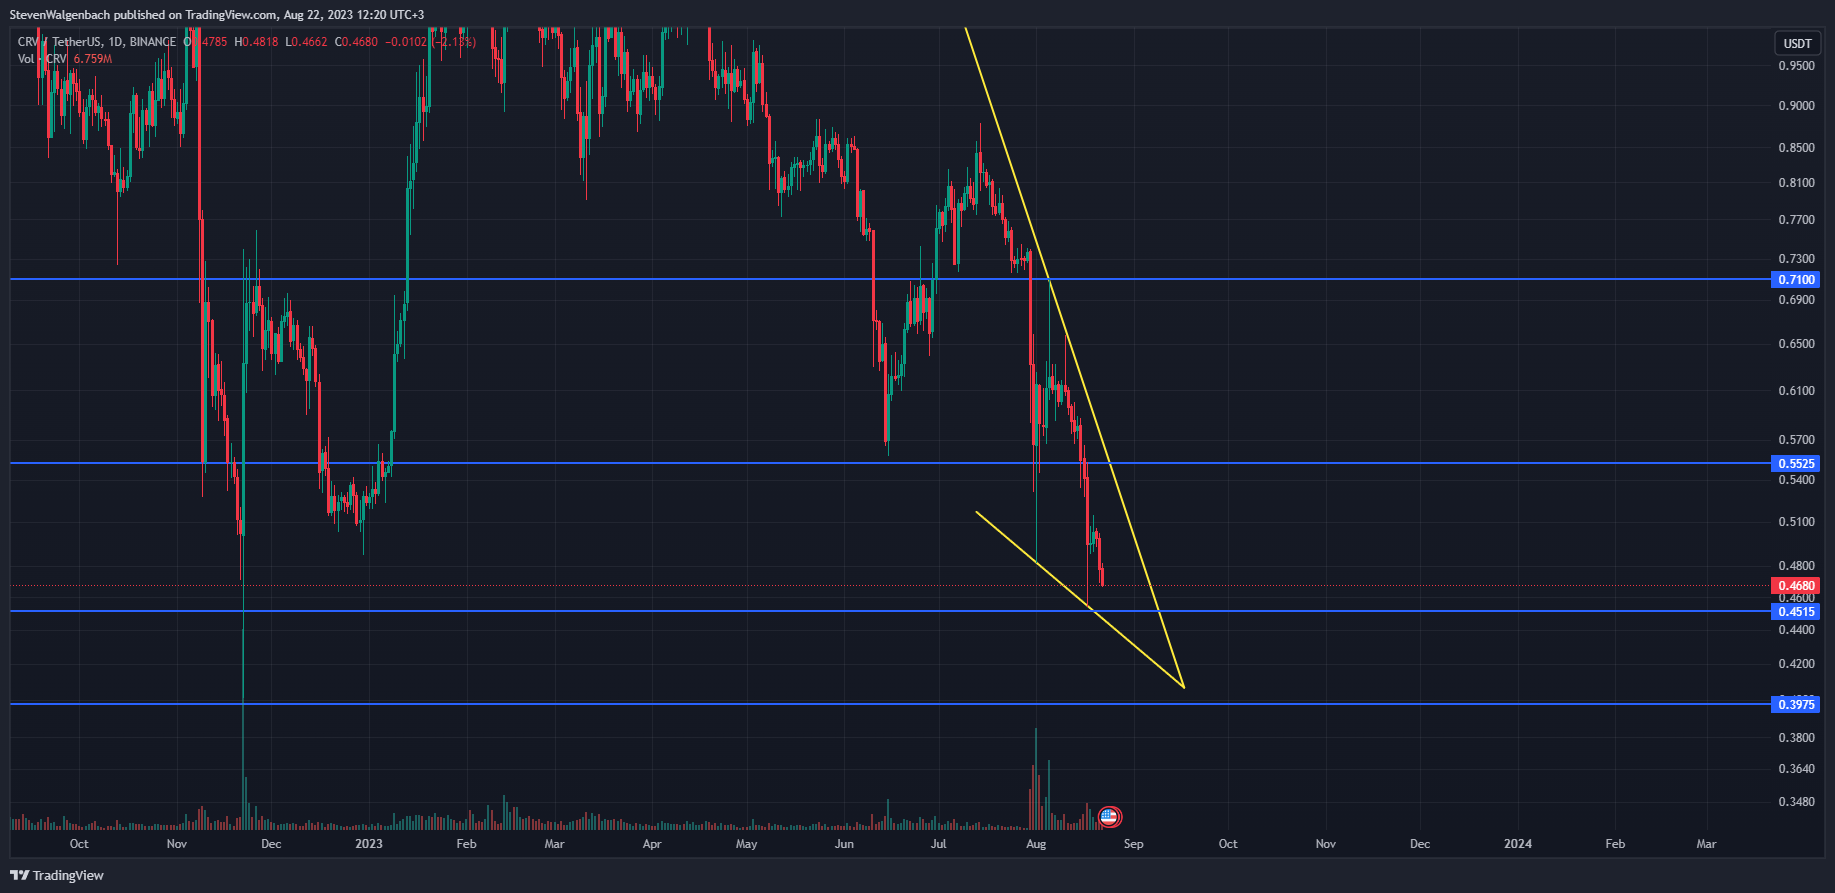
A steep falling wedge pattern had formed on CRV’s daily chart over the past few weeks. This is a bullish chart pattern that suggests a breakout towards the upside could take place in the next few days. If this pattern is validated, CRV’s price could attempt to reclaim the support level at $0.5525.
A break above this key threshold will then clear a path for the altcoin’s price to continue its climb toward the next significant resistance level at $0.7100 in the following weeks. This bullish thesis will be invalidated if CRV’s price closes a daily candle below $0.4515 within the next 72 hours. In this scenario, CRV could drop to as low as $0.3975 in the next few days.
Avalanche (AVAX)
Not far behind CRV was AVAX, which saw its price drop 4.09% during the last day of trading. As a result, the cryptocurrency’s price stood at $10.30. Along with the drop in its price, AVAX recorded a 34.74% increase in its daily trading volume – bringing the total volume to $109,367,502.
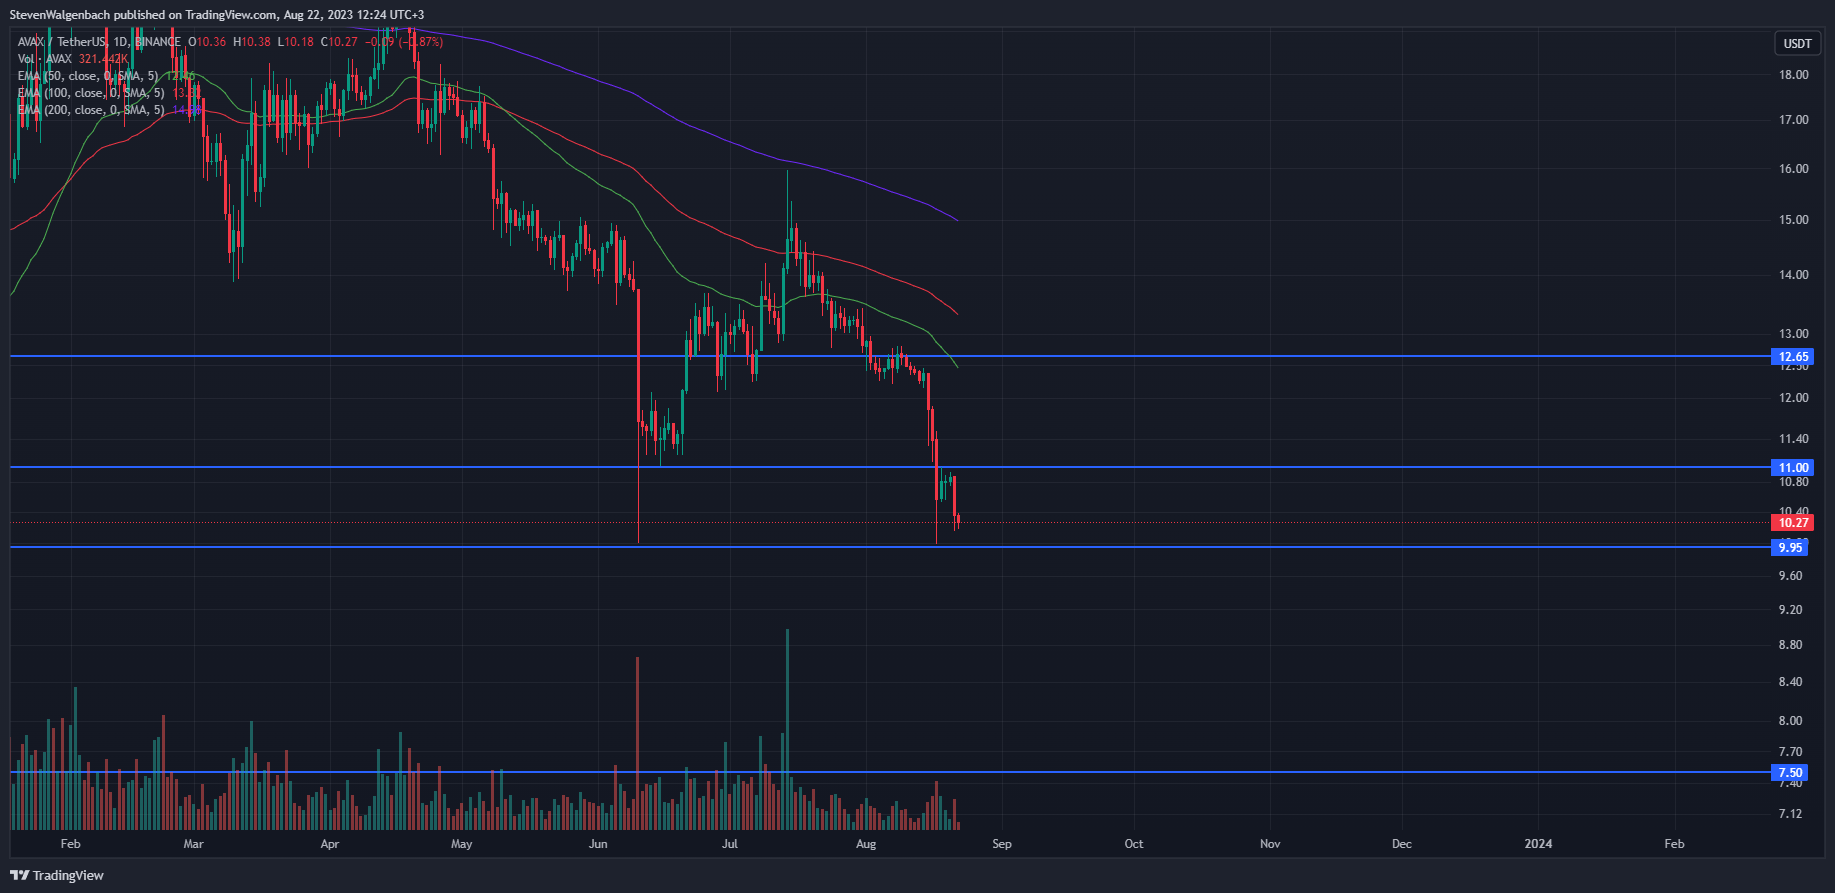
AVAX’s price may continue to drop in the coming 24-48 hours as medium and long-term momentum favored bears at press time. This was evident by the fact that the 50-day EMA line was positioned below the 100-day EMA line. Furthermore, both of these technical indicators were positioned below the 200-day EMA line as well.
A confirmation of this bearish thesis will be when AVAX’s price closes a daily candle below $9.95. Should this happen, the altcoin will be at risk of continuing a descent toward the next major support level at $7.50.
On the other hand, if AVAX is able to close a daily candle above $11, then the bearish thesis will be invalidated. In this scenario, the cryptocurrency’s price may attempt to challenge the $12.65 mark in the following two weeks.
Polygon (MATIC)
MATIC was changing hands at $0.5476 following its 24-hour loss of 3.98%. This negative daily performance dragged the Layer-2 cryptocurrency’s weekly performance further into the red zone to -18.99% at press time.
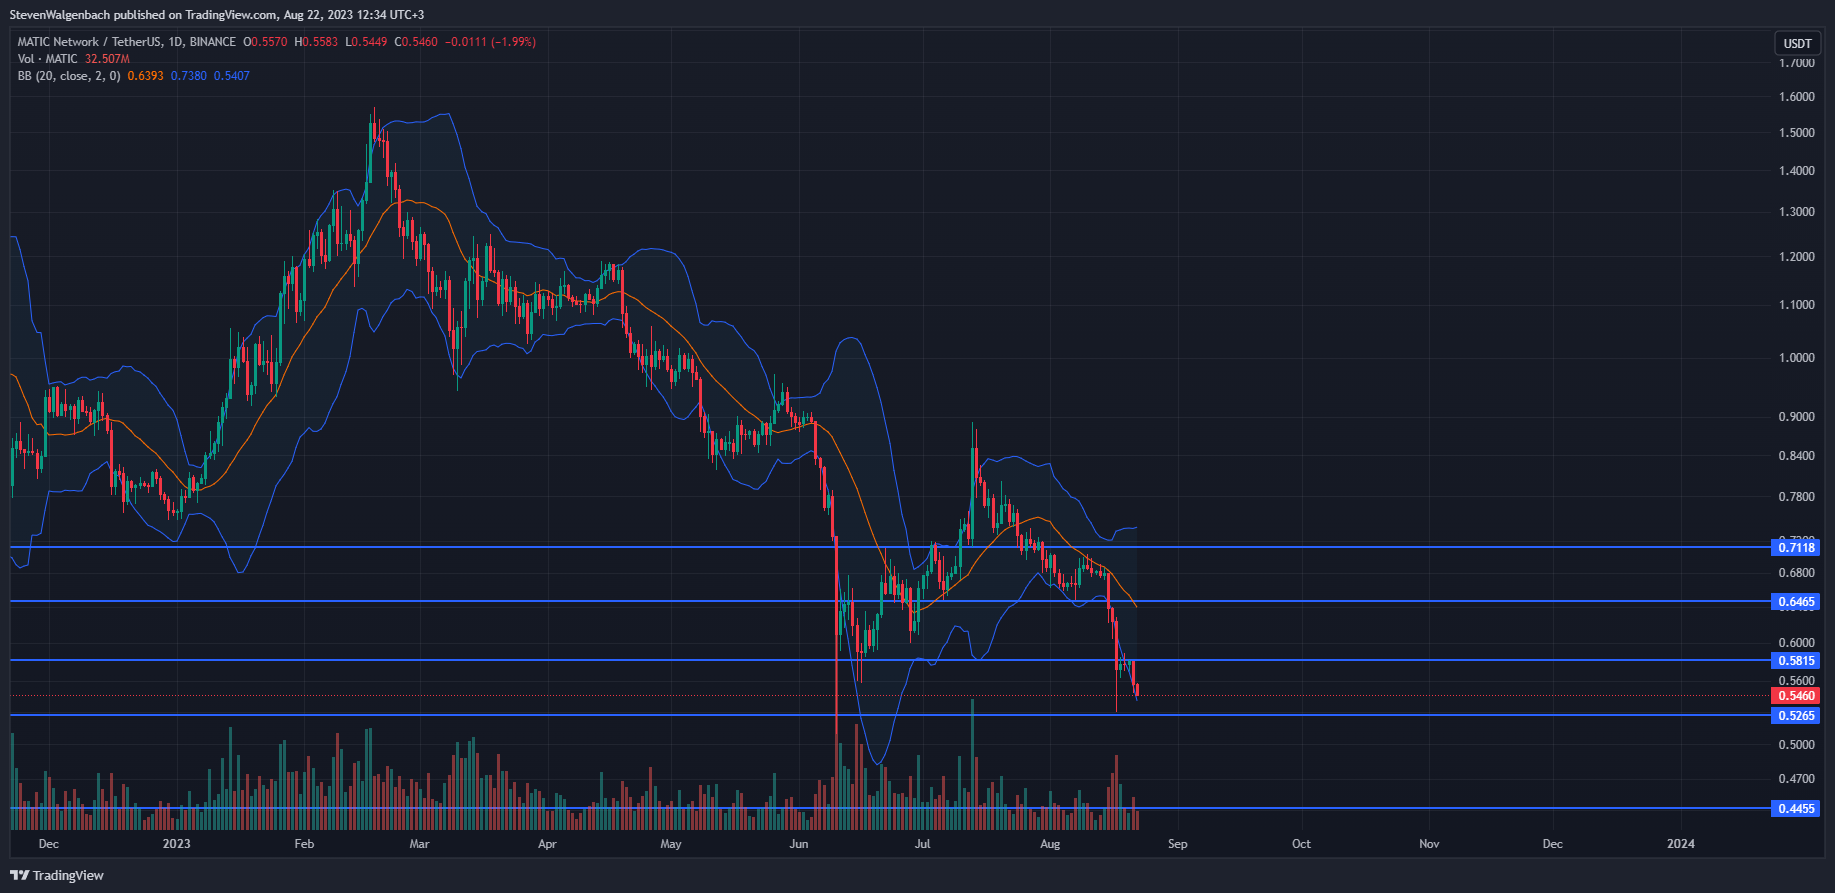
MATIC’s price was trading on the lower level of the Bollinger Bands (BBANDS) indicator at press time. This suggested that the altcoin’s price may rise in the next 24 hours. If this bullish thesis is validated, then MATIC may look to flip the $0.5815 resistance into support before climbing to the middle level of the BBANDS indicator at around $0.6465.
Continued buy support could then push the altcoin’s price up to the next key barrier at $0.7118 in the following week. This bullish thesis will be invalidated, however, if MATIC’s price drops below the $0.5265 support. Should this happen, MATIC will be at risk of falling to $0.4455 towards the end of this month.
Filecoin (FIL)
FIL’s 3.86% price decrease throughout the previous 24 hours meant it was the 4th worst performer in the cryptocurrency market. This poor price movement brought the altcoin’s price down to $3.40 at press time.
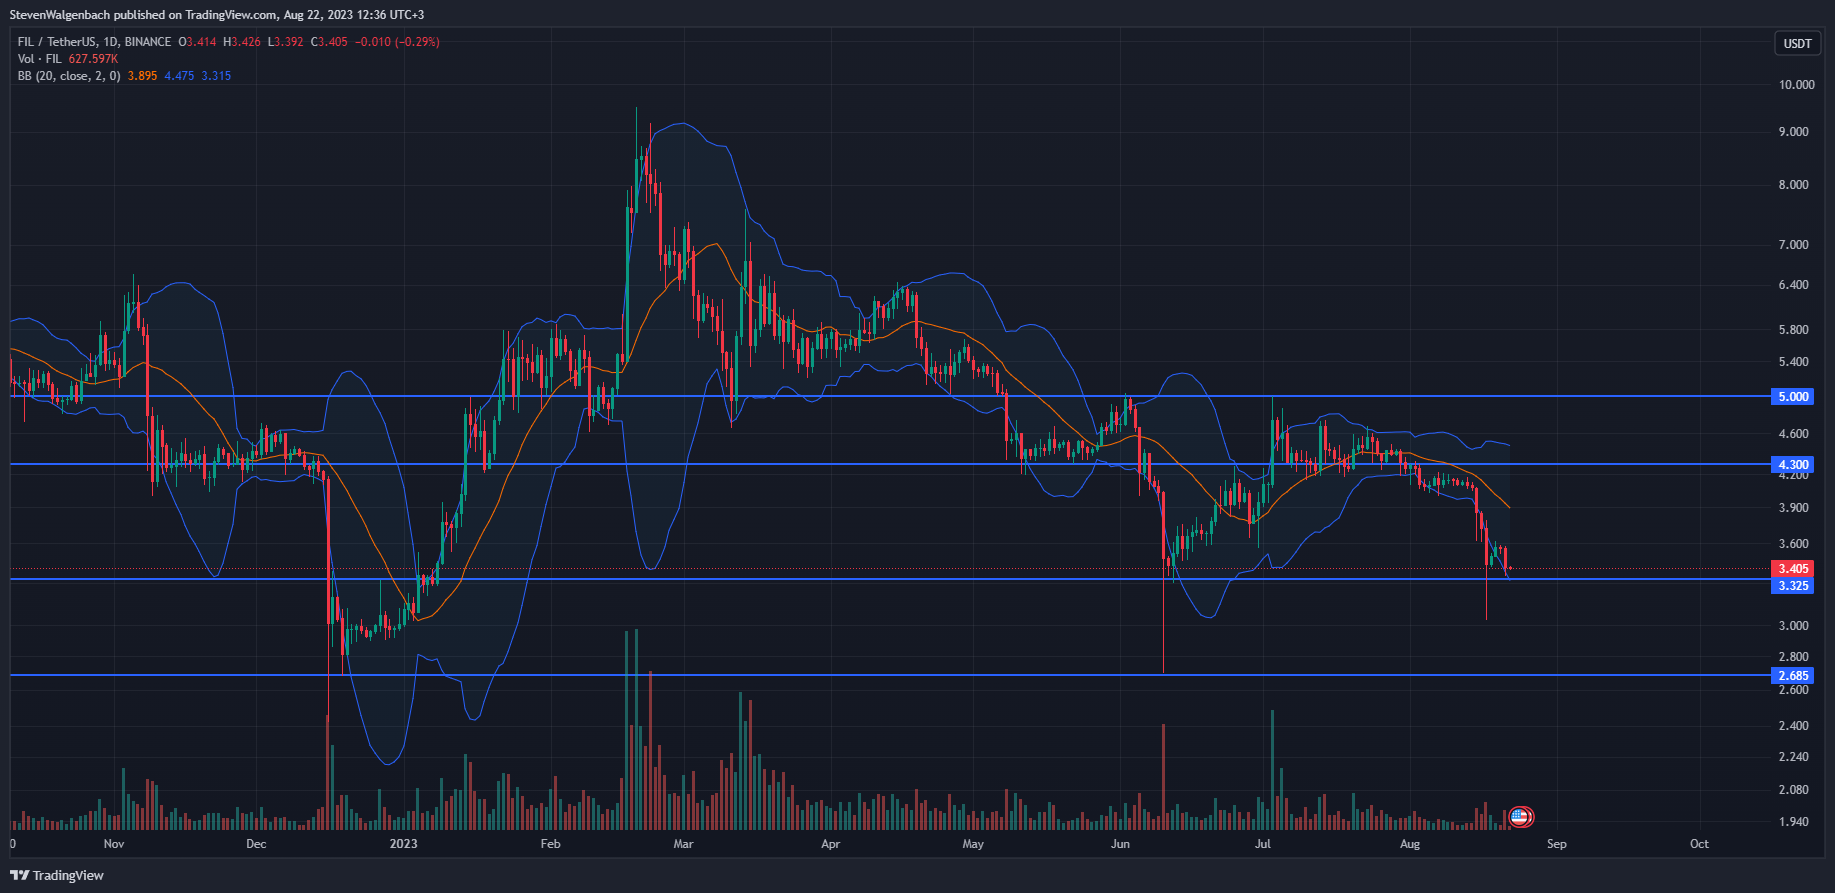
Similar to MATIC, FIL’s price was also resting on the lower level of the BBANDS indicator at press time, suggesting that the cryptocurrency’s price may also increase in the coming 24 hours. If this bullish thesis plays out, then FIL could look to rise to the middle level of the indicator at around $3.895.
If FIL succeeds in closing a daily candle above this price point, then it may continue to climb to attempt to flip the $4.30 resistance level into support. This will then clear a path for FIL’s price to rise toward the next major resistance level at $5. Before FIL’s price can reach this point, however, it will need to close a daily candle above the upper level of the BBands indicator.
On the other hand, if FIL’s negative momentum continues in the next few days, it may break below the crucial support at $3.325. In this scenario, continued sell pressure may force the altcoin’s price down to $2.685 in the following two weeks.
ApeCoin (APE)
APE’s price stood at $1.52 at press time after it declined just over 3.3% during the past 24 hours. The cryptocurrency was trading very close to its 24-hour low of $1.51, which suggested that it may drop below this price point in the next 24 hours. Meanwhile, the altcoin’s daily high stood at $1.58.
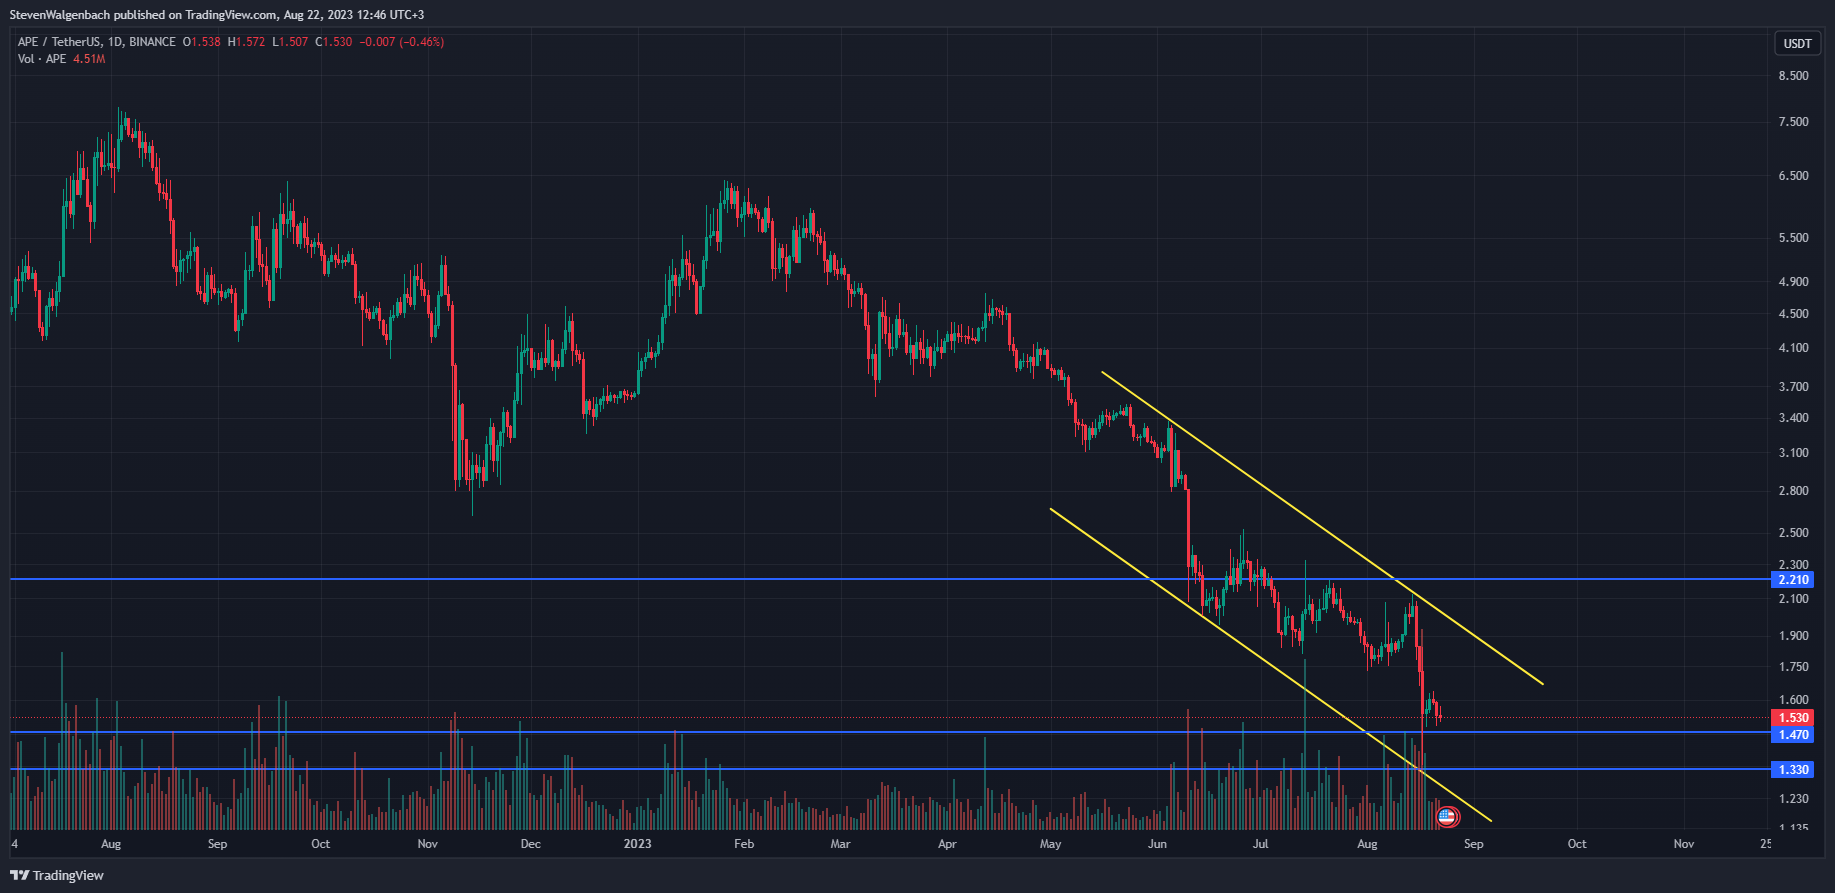
APE’s price continued to trade within a negative channel on its daily chart. It had been in this negative sequence for the past two months. Should this bearishness continue, APE will be at risk of breaking below the next key support level at $1.470. Continued sell pressure will then lead to the altcoin retesting the $1.330 support.
However, if bulls identify APE’s current price as a good buy opportunity, then APE’s price may attempt to break out above the upper level of the negative price channel. This will then open up the possibility for APE to flip the $2.210 resistance into support.
Disclaimer: The views and opinions, as well as all the information shared in this price analysis, are published in good faith. Readers must do their own research and due diligence. Any action taken by the reader is strictly at their own risk. Coin Edition and its affiliates will not be held liable for any direct or indirect damage or loss.
 coinedition.com
