- 1 Sui crypto’s price decreased by 12.77% over the last week and is down by 3.53% over the last 24 hours.
- 2 The price of the SUI crypto is trading at $0.5190 and the 52-week range is $0.4380 – $1.0980.
The SUI crypto (BITFINEX: SUI) has not performed well in the last month, decreasing by 24.56% and by 56.50% in the last six months.
Sui crypto declined by 6.83% in market value and also plummeted by 34.97% in trading volume in the last 24 hours, as per Coinmarketcap, a crypto data analysis website. Its market value is $382,682,823 and its trading volume is $160,743,483. There are 723,162,190 SUI in circulation.
Sui Crypto’s (SUI) open interest is $47.98 Million. As per Coinglass, another crypto analysis website, it fell by 2.79% in the previous session. The long versus short ratio for 24 hours is 0.8563. The short liquidation is $4.87K versus $51.59K for the long liquidation.
According to the news published by Sui itself on the coinmarketcap website which is a crypto data analysis website. Sui welcomed @SinaNader33 as the designation of Head of Strategy. He was formerly designated at, Robinhood, FTX US, and Morgan Stanley.
Sui Price Technical Analysis in the 1-Day Timeframe
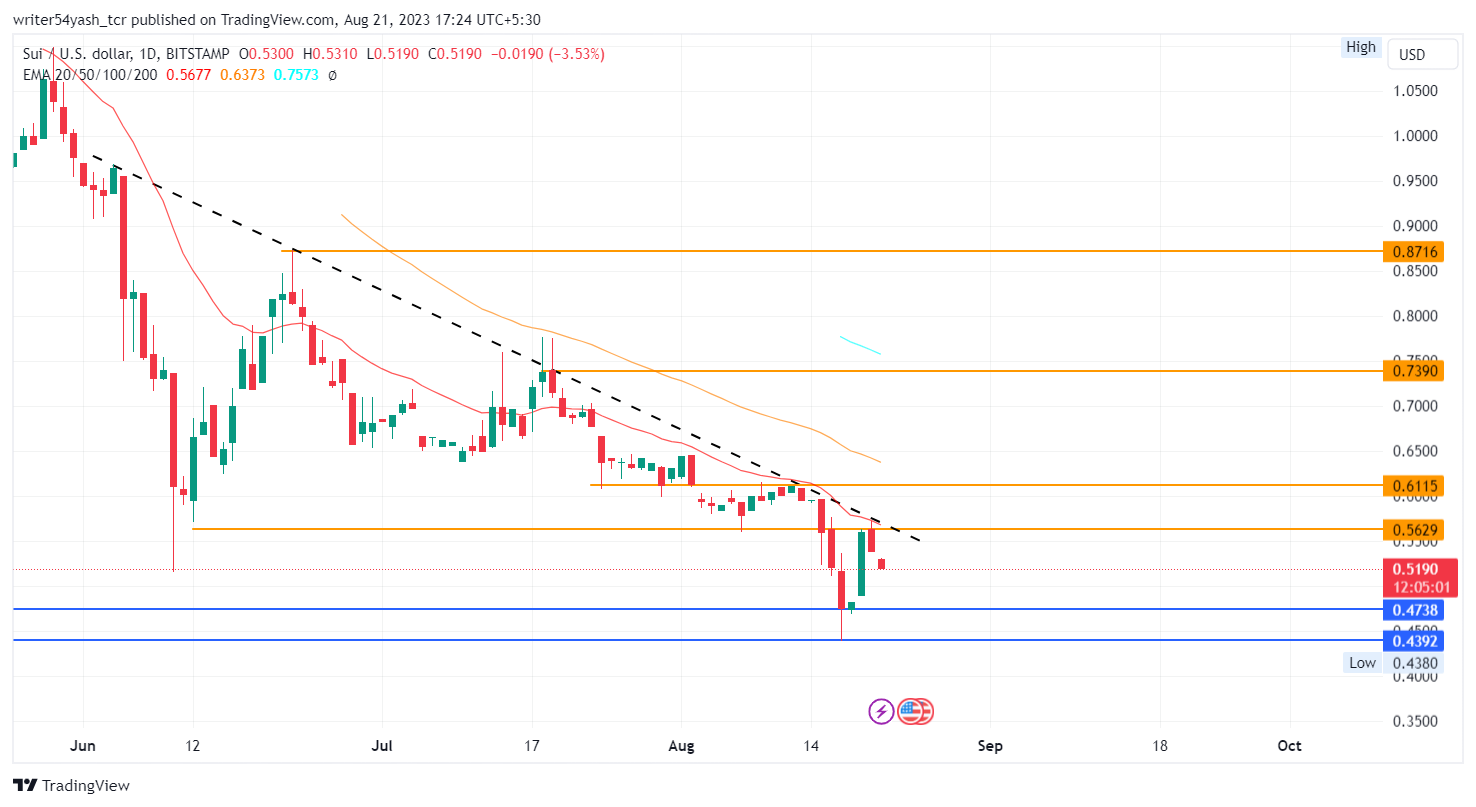
At the time of publication, the SUI crypto’s current price is trading around $0.5190 and facing trendline resistance and decline.
Therefore, If Sui fails to maintain the current level, the SUI crypto price could continue to drag downwards and hit the nearest support levels around $0.4738 and $0.4392.
However, if the crypto price sustains the current level and the Sui price increases, then it might reach the nearest resistance levels of $0.5629 and $0.6115.

At the time of publishing, the SUI crypto price (BITFINEX: SUI) is trading beneath the 20, and 50-day exponential moving averages (EMA), which is declining the SUI crypto price trend down.
Hence, SUI crypto price prediction estimates the prices to decline downwards, indicating a bearish overview over the daily time frame chart for its price.

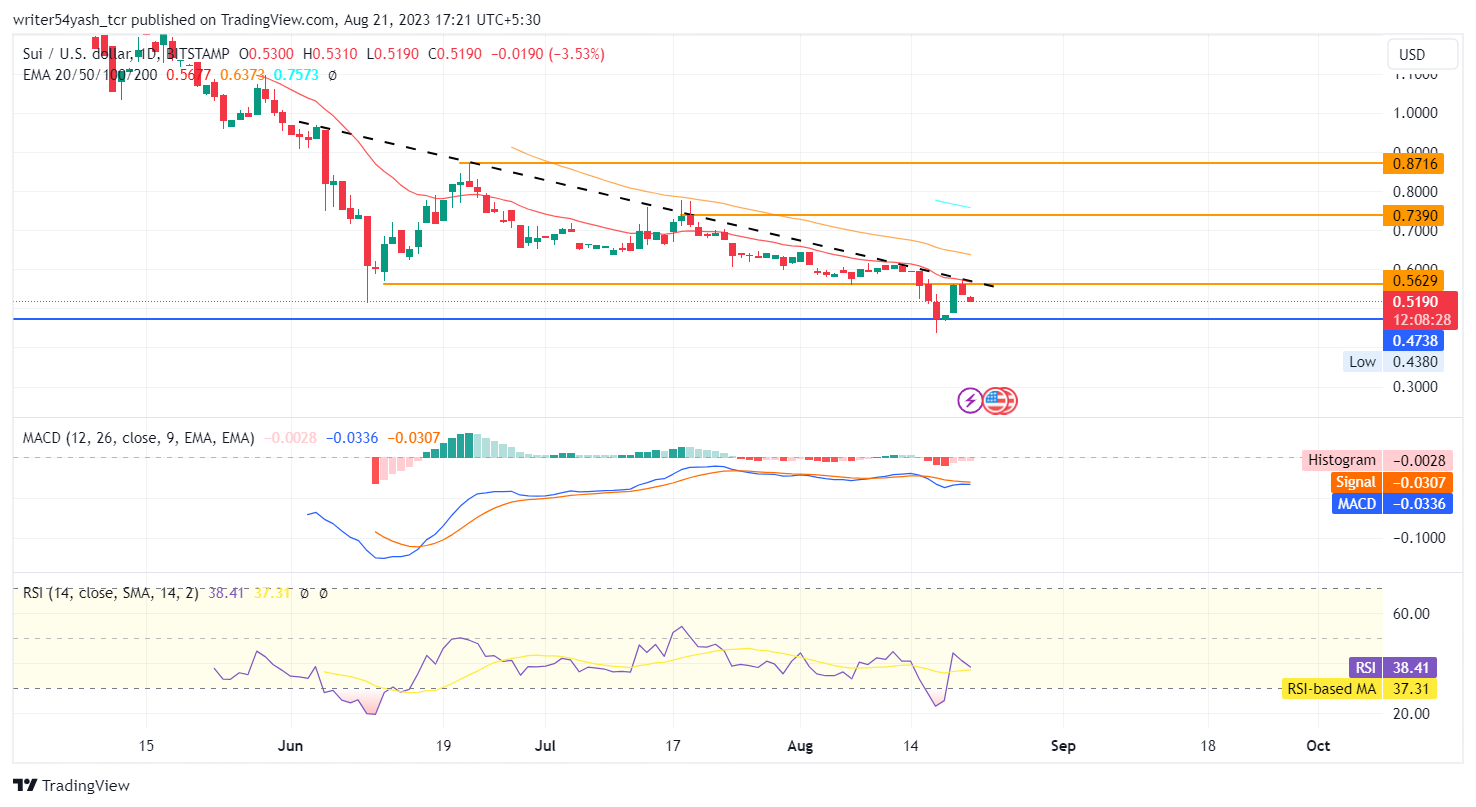
The MACD line at 0.0336 and the signal line at 0.0307 is below the zero line both lines crossed down to each other and a narrowed bearish crossover is spotted in the MACD oscillator, indicating consolidation to bearish signals in SUI crypto. The current value of the RSI is 37.31 points and the 14-day SMA is below the median line at 37.31 points, which indicates consolidation to bearish sentiments in the SUI price.
Conclusion
SUI crypto price prediction highlights the bearish sentiments and perspectives regarding SUI crypto in the daily time frame. Sui price action highlights a bearish view at the time of publishing. Moreover, the technical parameters of the Sui price suggest the continuation of the downtrend over the daily time frame chart. Major reliable and trustworthy indicators MACD, RSI, and EMA, suggest bearish signals regarding the SUI crypto price.
Technical Levels:
- Support levels: The nearest support levels are $0.4738 and $0.4392.
- Resistance levels: The nearest resistance levels are $0.5629 and $0.6115.
Disclaimer
In this article, the views and opinions stated by the author, or any people named are for informational purposes only, and they don’t establish the investment, financial, or any other advice. Trading or investing in cryptocurrency assets comes with a risk of financial loss.
 thecoinrepublic.com