- 1 Stellar crypto price is currently trading at $0.125031 with a drop of -3.54% in the last 24 hours.
- 2 XLM has a current market cap of $3.422 Billion.
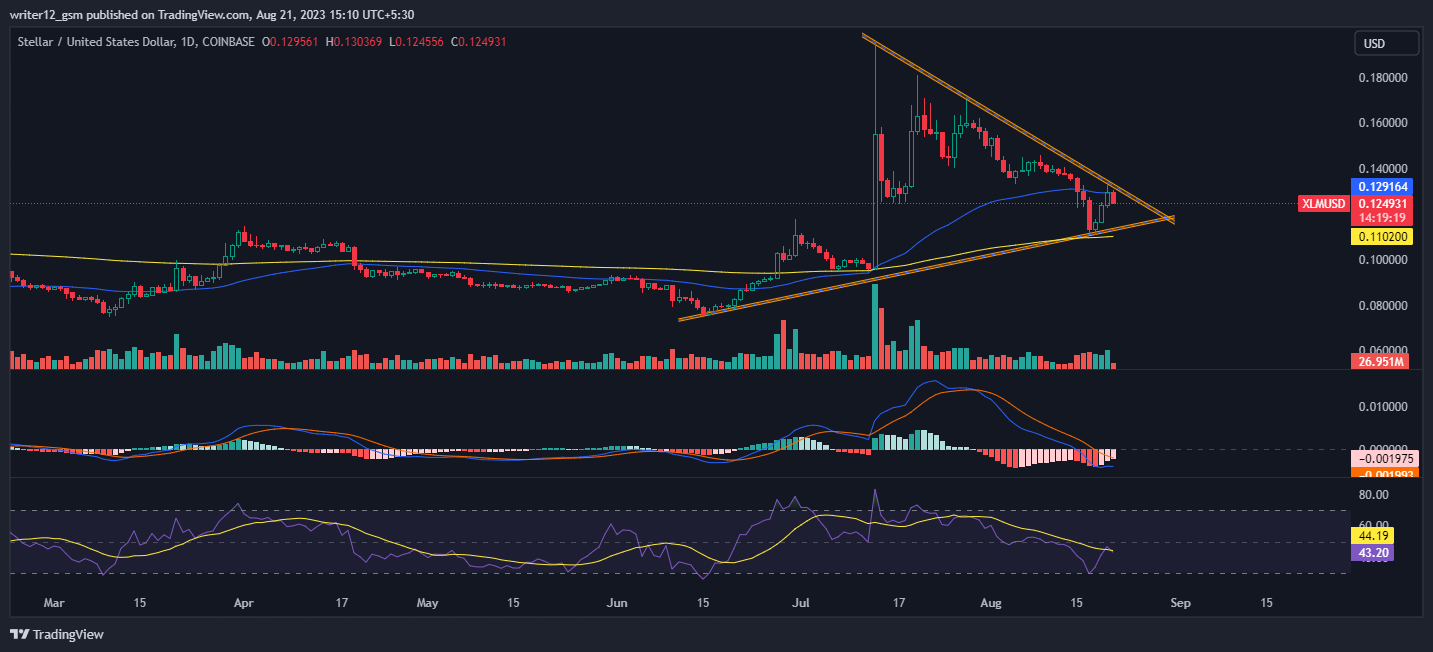
- 3 XLM trading in an interesting triangle pattern.
Stellar crypto price prediction is suggesting bears and bulls are yet to gain a proper grasp on the trend. Investors might prefer to wait for a confluence of multiple technical indicators in order to decide the direction of the trend. There is a slight increase in the green candles of volume which suggests the XLM price is attracting buyers at the demand zone.
Investor sentiments regarding the Stellar price are indecisive at present and may remain negative unless the buyers start stepping into the price action with substantial momentum. However, according to the technical indicators and price action, the odds are lining up in the neutral phase.
Stellar crypto price needs to attract buyers to surge towards the upper trendline of the consolidation phase over the daily time frame chart. Meanwhile, the Stellar crypto price is trying to gather support and surge towards 20, 50, 100, and 200-day Daily Moving Averages. Stellar crypto has been consolidating inside the horizontal price range of $0.130369 and $0.125257.
Nevertheless, Stellar crypto price has declined around -9.05% in a week and decreased -20.37% in a month. Also, XLM’s crypto price gained around 41.98% in the last three months and 32.01% over the last six months. However, the XLMUSD chart shows a declining streak in the previous month. But analysts believe that the crypto price may bounce back from lower levels.
Technical Analysis of Stellar Crypto Price in 1-D Timeframe

Stellar (XLM) has steadily seen its crypto price rise for the past three months, gaining 41.74%. However, the crypto price plunged -20.53% in the last month. Currently, XLM crypto is trading at $0.125031 and has been trying to hold on to this level.
If it can keep this level, the Stellar price could continue to go up and reach the first and second targets of $0.199 and $0.248. However, if the XLM price cannot maintain this level and falls, then it might hit the closest support levels of $0.0098 and $0.046.
Currently, Stellar crypto (XLM) is trading between the 50 and 200-day SMAs (simple moving averages), which are supporting the price momentum.
However, if buying volume adds up, then the price might support bullish momentum by making higher highs and make new highs. Hence, the Stellar price is expected to move upward giving bullish views over the daily time frame chart.
The current value of RSI is 43.18 points. The 14 SMA is above the median line at 44.19 points which indicates that the Stellar crypto is bullish.
The MACD line at -0.003978 and the signal line at -0.003978 are above the zero line. A bearish crossover is observed in the MACD indicator which signals weakness in the momentum of the XLM crypto price.
Summary
Stellar (XLM) technical indicators also support the bullish trend. The MACD, RSI, and EMA are emphasizing positive signs and imply that the uptrend may continue in the XLM crypto price. Price action suggests that the investors and traders are bullish on the 1-day time frame. The price action reflects a bullish perspective at the moment. However, investors and traders should wait for proper setup for their next move and avoid the fear of missing out.
Technical Levels
- Support Levels: $0.0098 and $0.046.
- Resistance Levels: $0.199 and $0.248.
Disclaimer
The analysis provided in this article is for informational and educational purposes only. Do not rely on this information as financial, investment, or trading advice. Investing and trading in crypto involves risk. Please assess your situation and risk tolerance before making any investment decisions.
 thecoinrepublic.com