Bitcoin
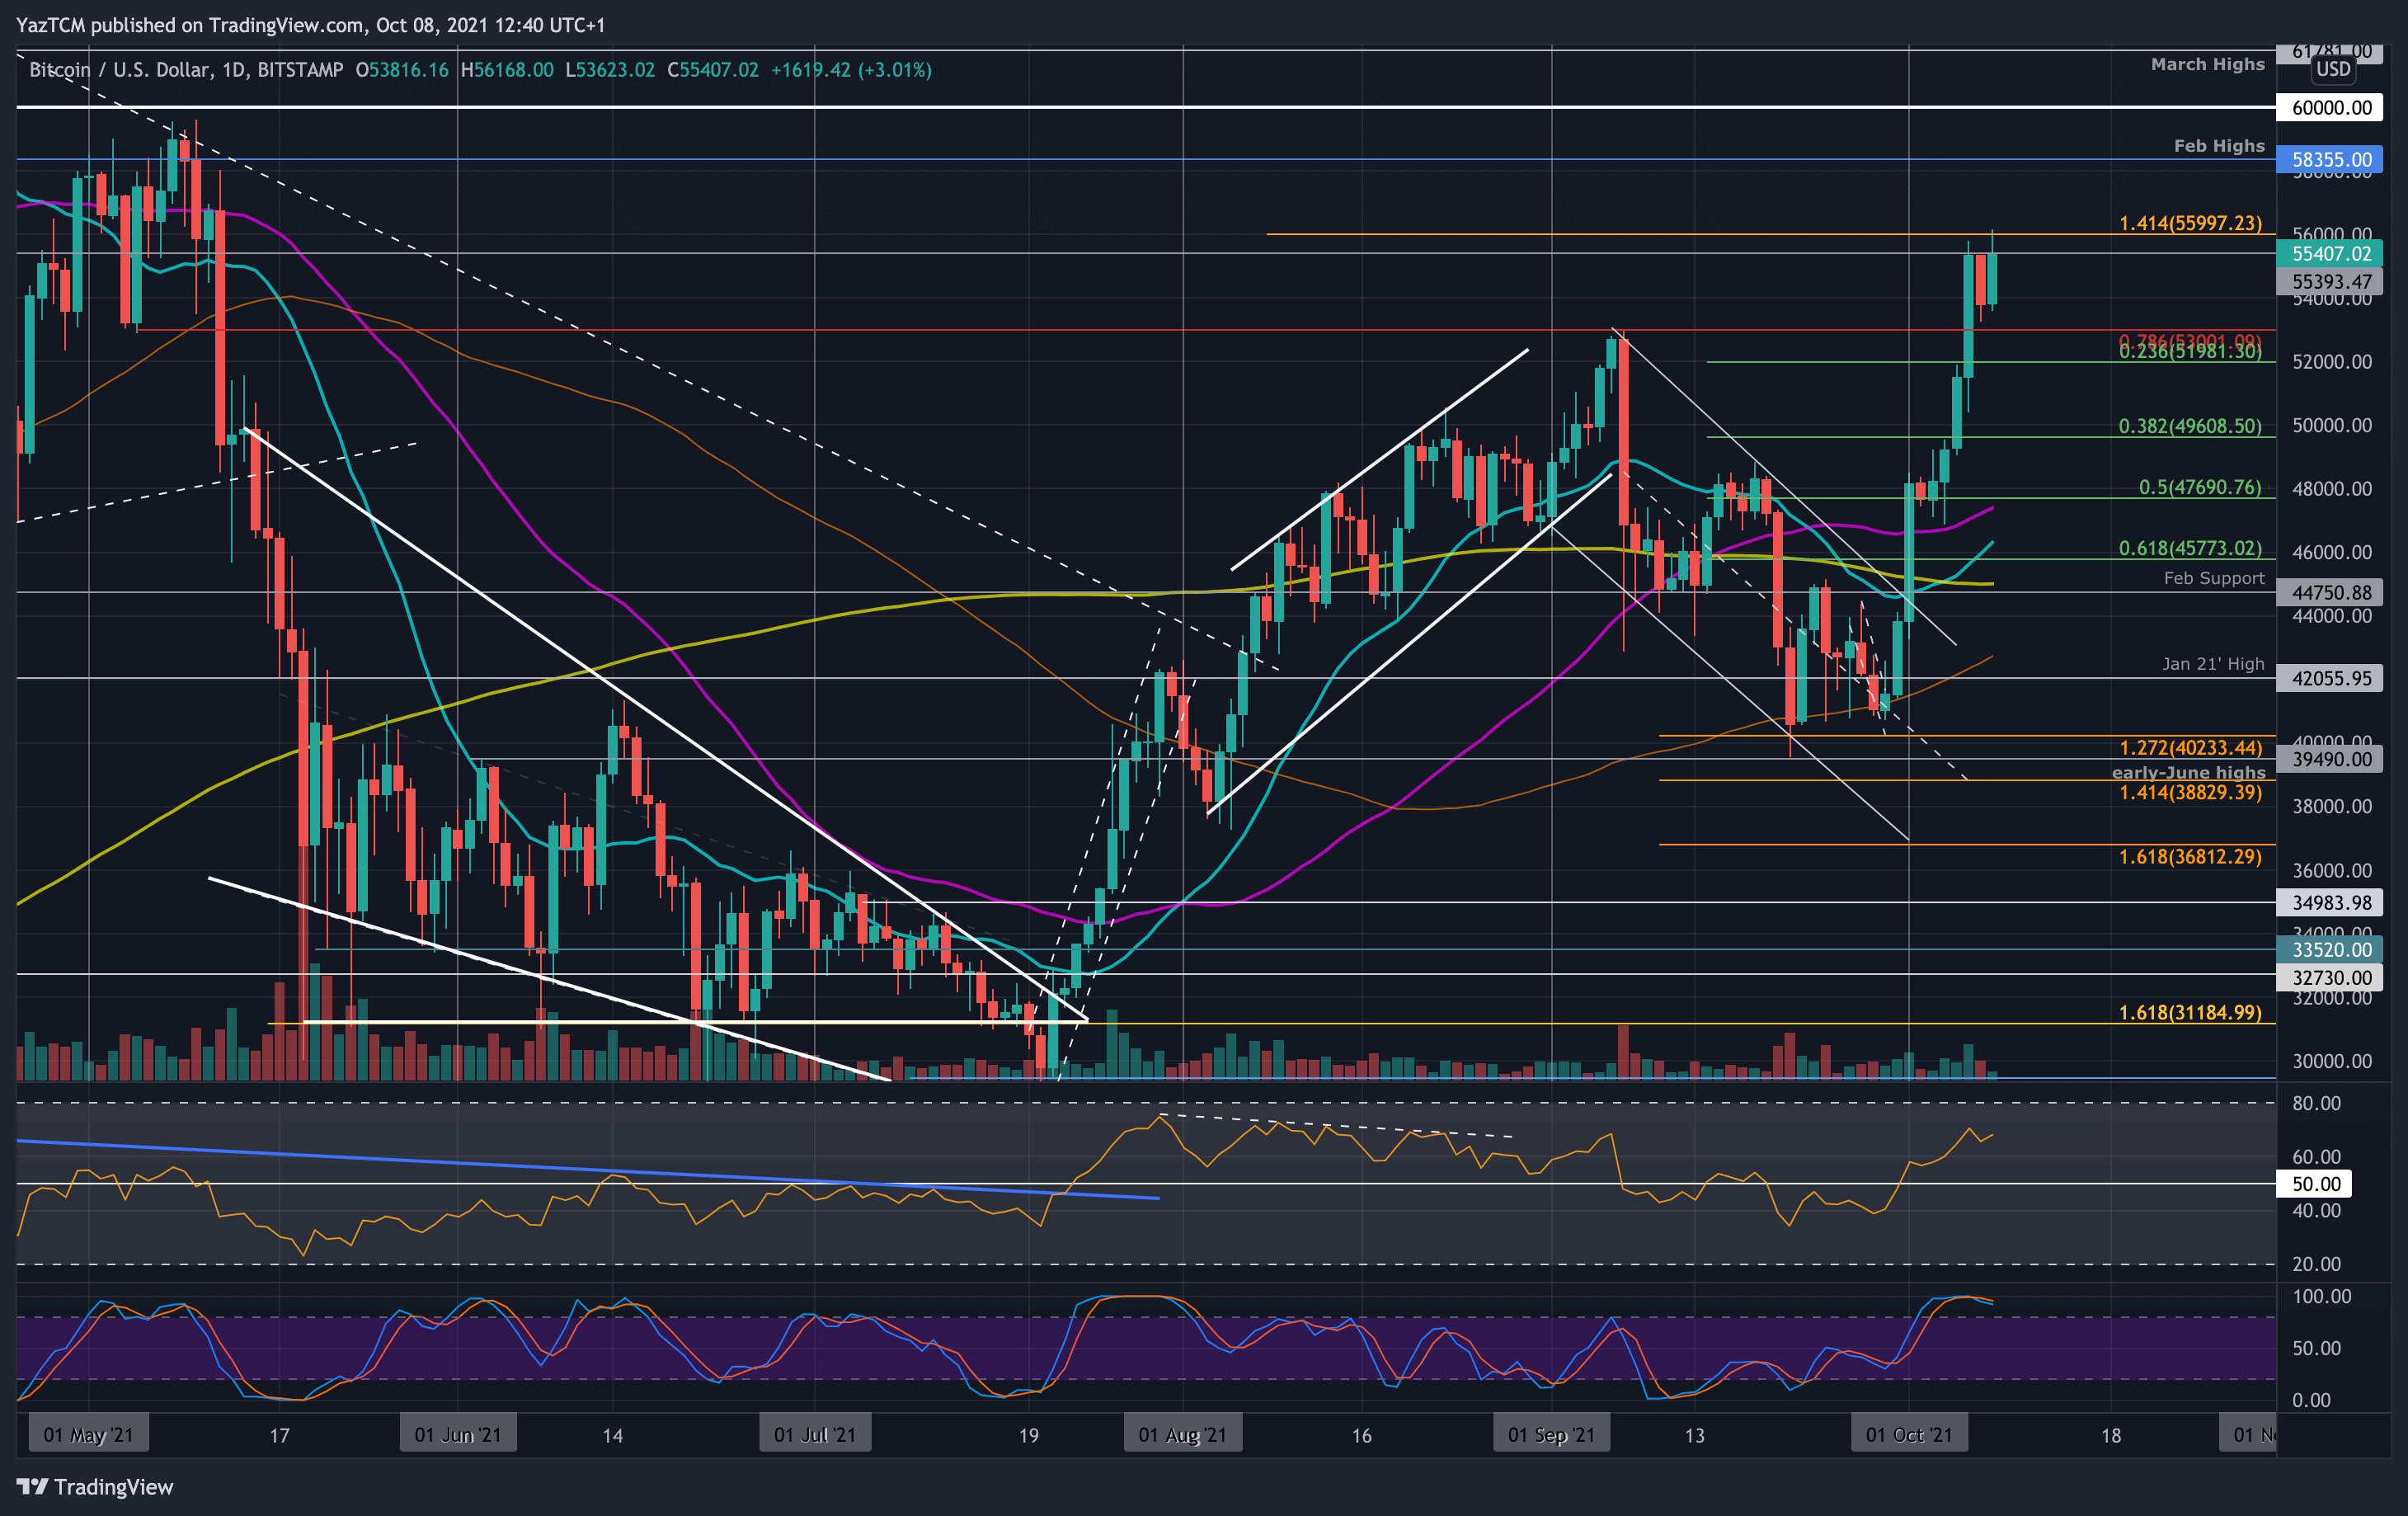
Bitcoin is up by an incredible 25.7% this week as the cryptocurrency surges beyond $55,000. The increase started at the beginning of October when it managed to break above a descending price channel and go above the 50-day MA.
Since then, BTC surged higher during the week until it broke the September highs at $53,000 and met resistance at $55,400 on Wednesday. It did attempt to break above $55,400 today, reaching as high as $56,000 (1.414 Fib Extension) but is showing signs of struggle to close above $55,400.
Looking ahead, if the buyers break above $56,000, the first resistance is expected at $58,355 (Feb 2021 highs). This is followed by $60,000, $61,000, and $61,780 (March 2021 highs).
On the other side, the first support lies at $54,000. This is followed by $53,000 (September highs), $52,000 (.236 Fib), $50,000, and $49,600 (.382 Fib). Additional support lies at $47,690 (.5 Fib & 50-day MA).
Ethereum
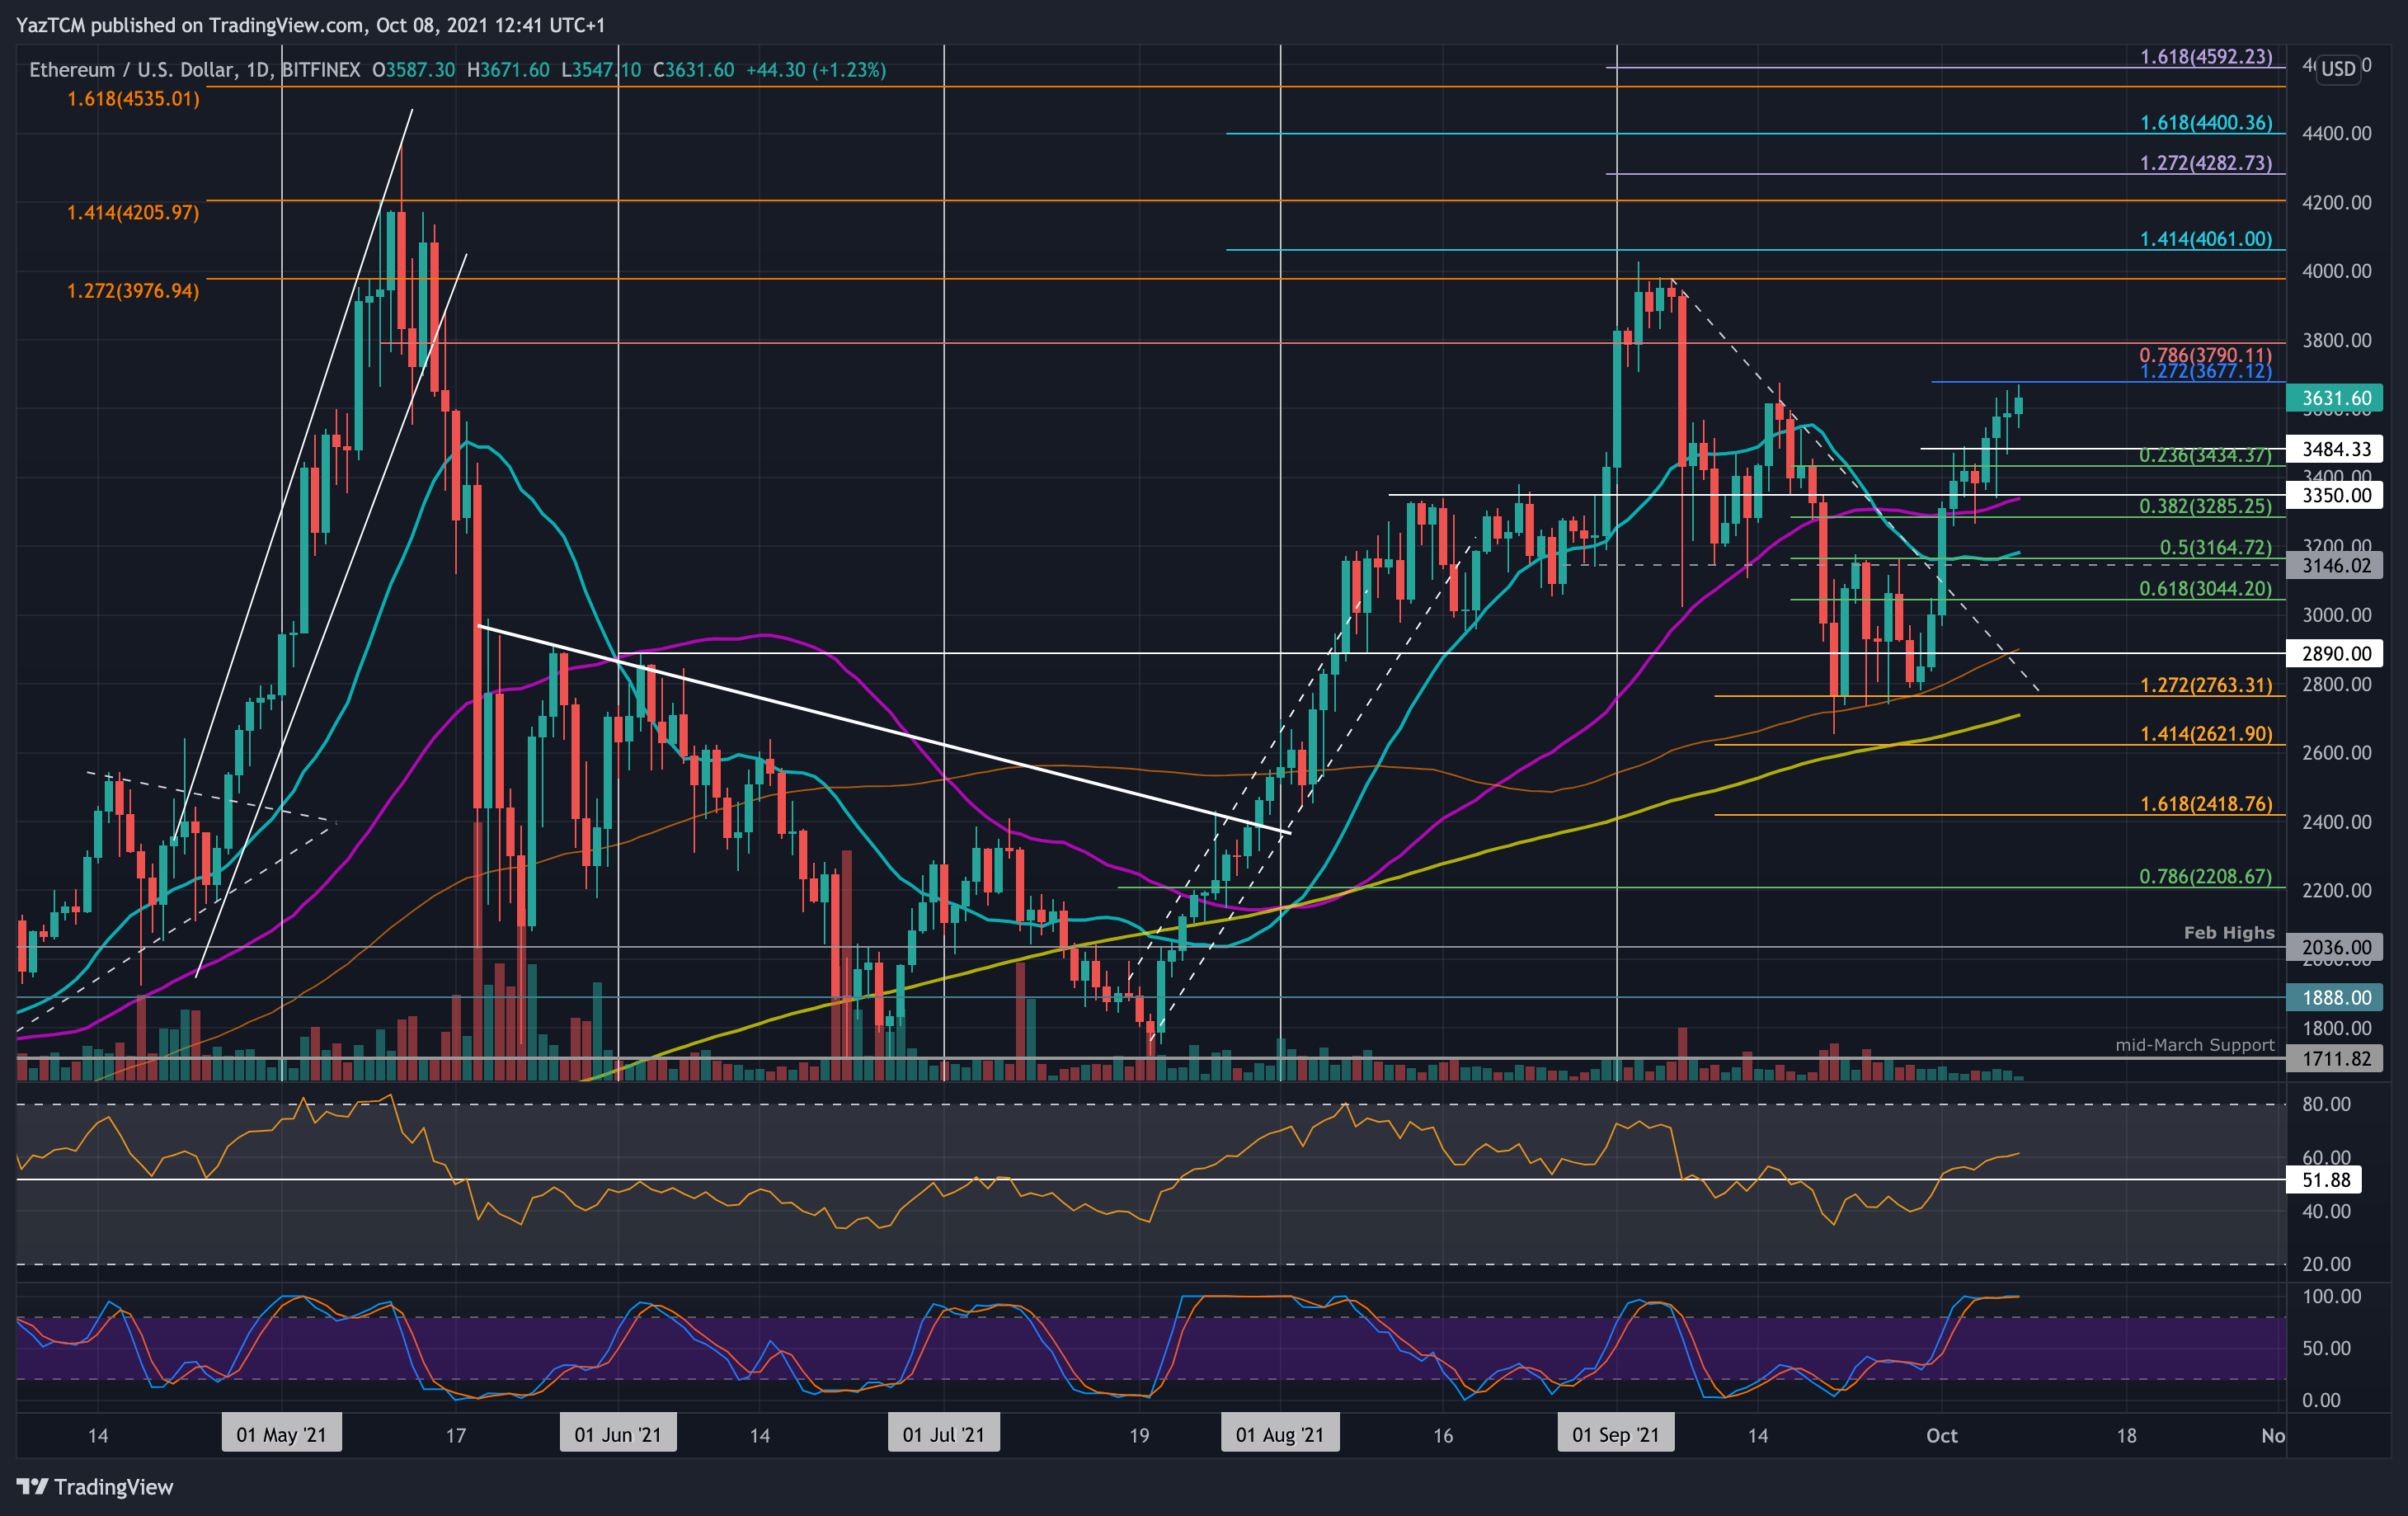
Ethereum is up by a solid 20% over the course of the week as the coin currently trades at around $3630. The cryptocurrency had surged above a descending trend line last Friday as it surged beyond $3000 and climbed above the 50-day MA.
As the week progressed, ETH continued to slowly grind higher and higher each day. Today, ETH spiked as high as $3677, where it met resistance at a 1.272 Fib Extension level.
Looking ahead, if the buyers break above $3677, the first resistance lies at $3790 (bearish .786 Fib). This is followed by $4000, $4060 (1.414 Fib Extension), $4200 (1.414 Fib Extension – orange), $4282, and $4400 (1.618 Fib Extension – blue).
On the other side, the first support lies at $3485. This is followed by $3350 (50-day MA), $3285 (.382 FIb), $3165 (.5 Fib & 20-day MA), and $3000.
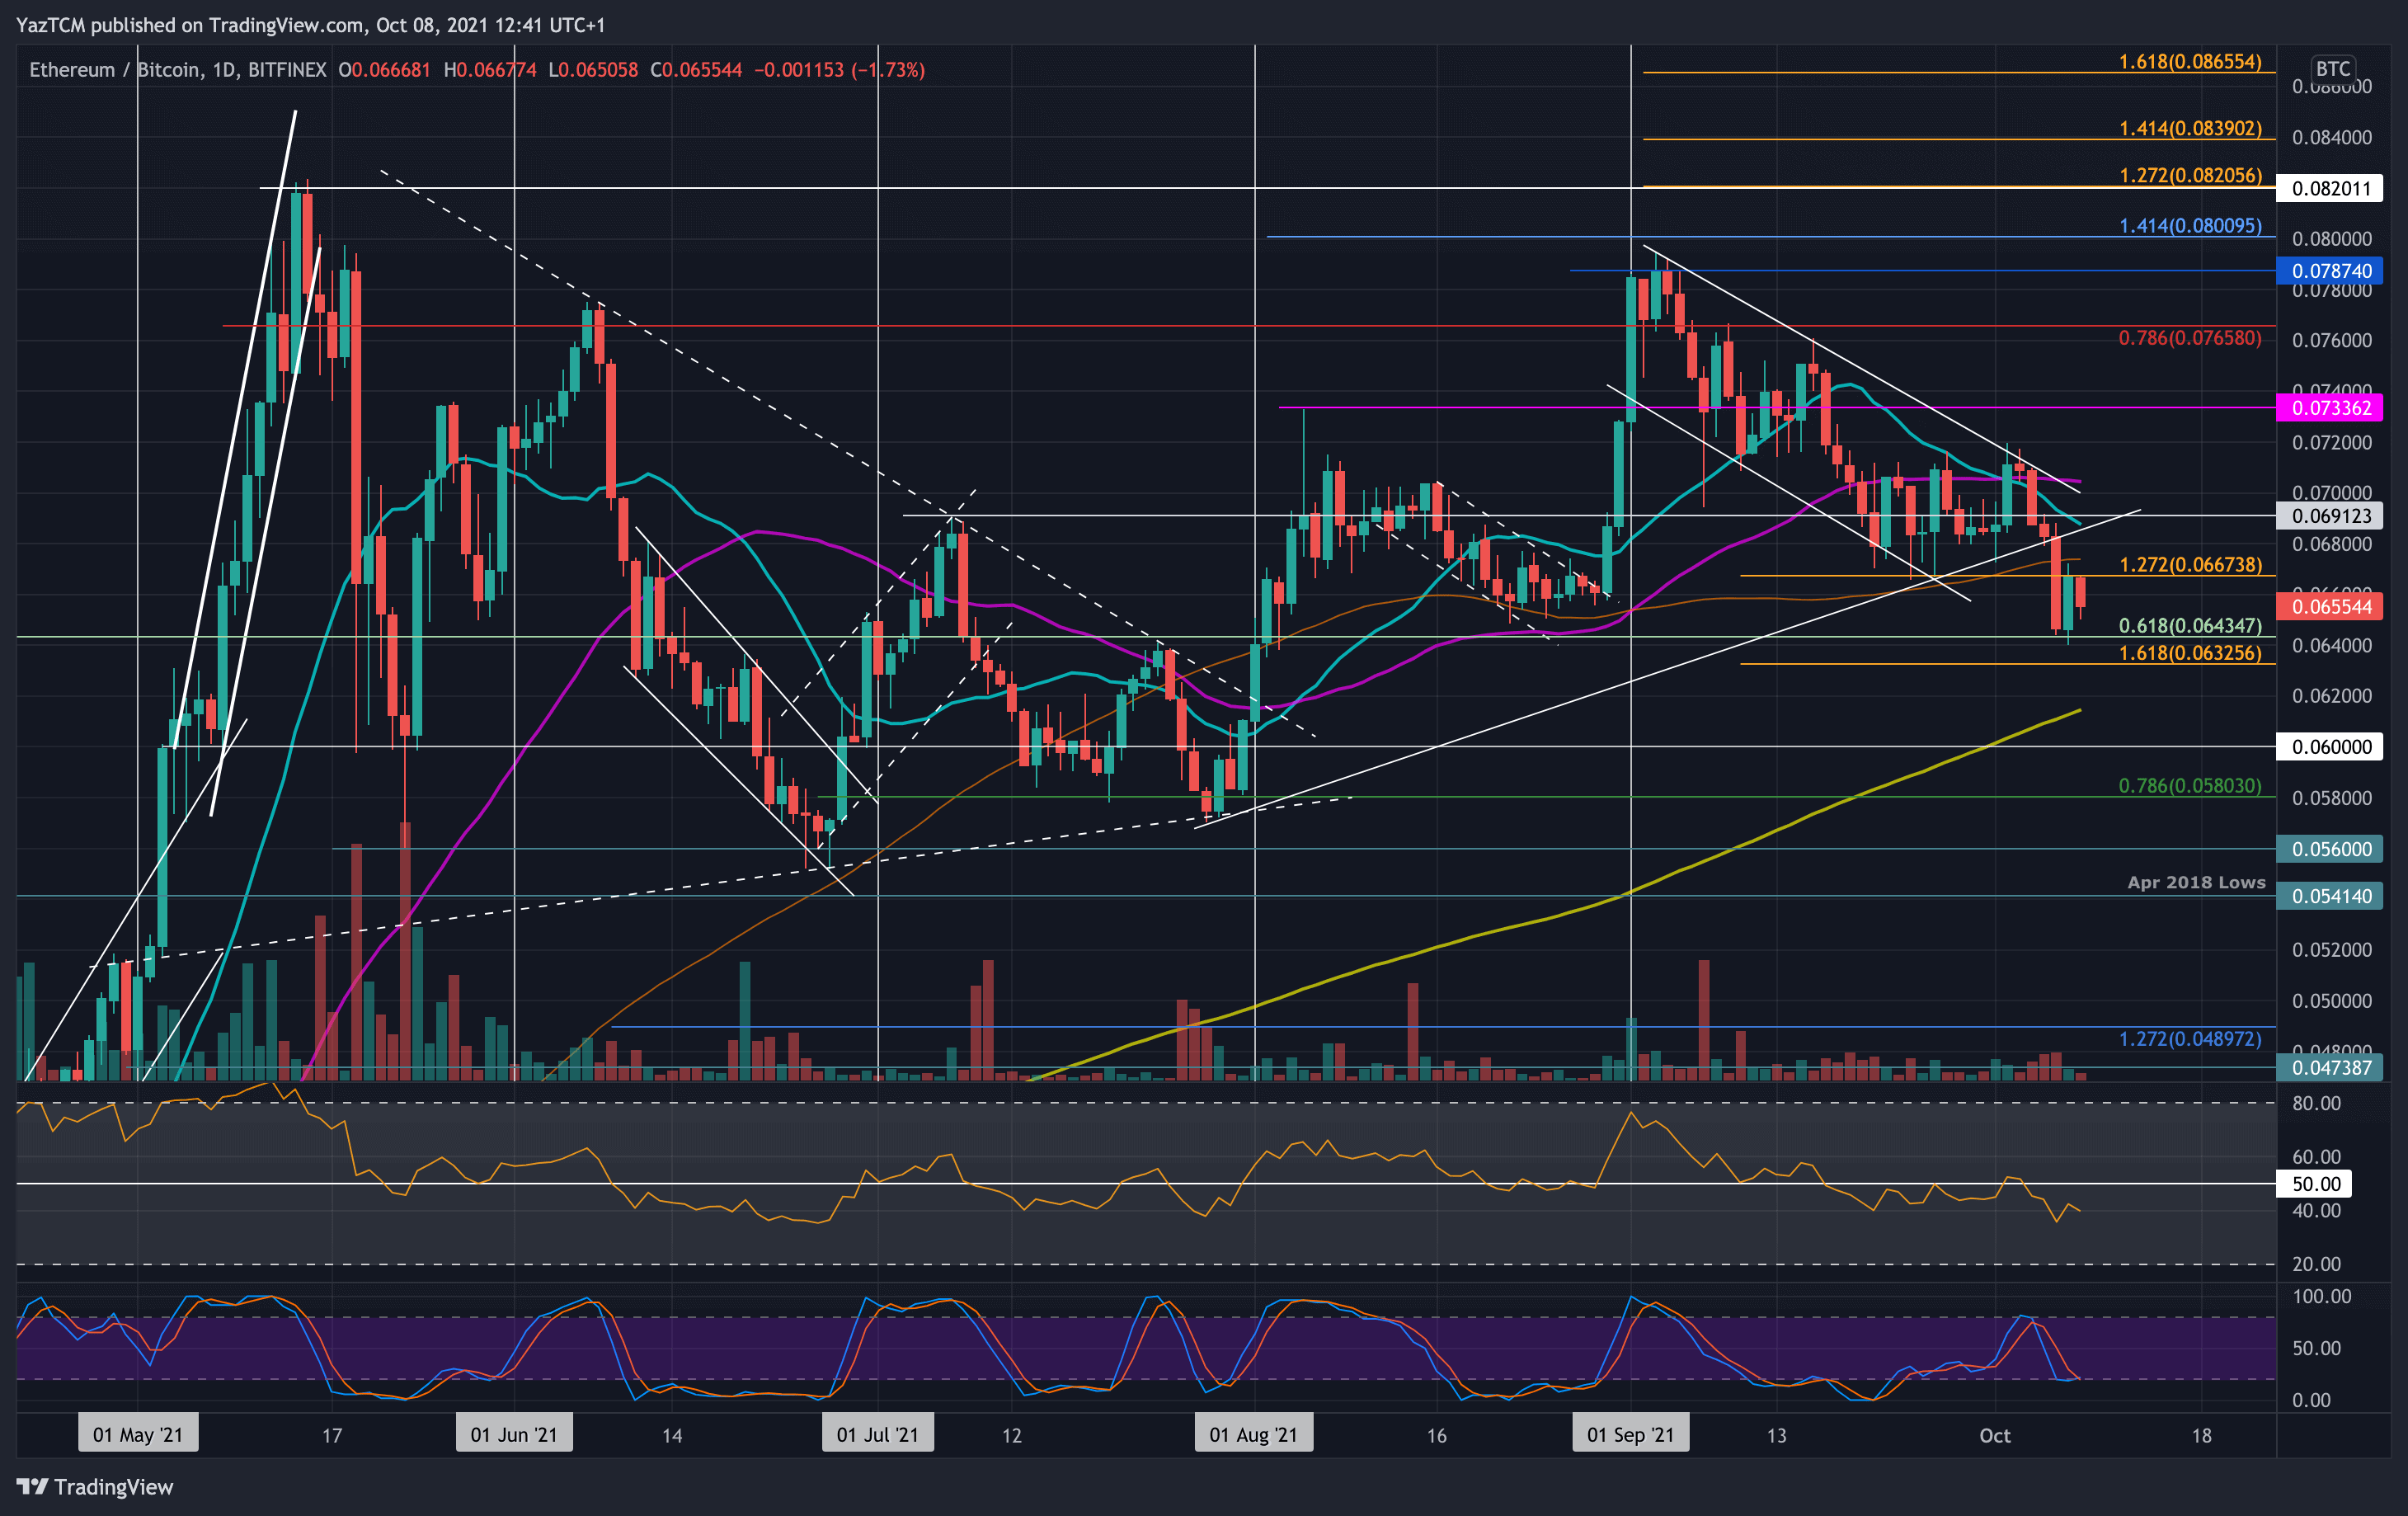
ETH is struggling quite significantly against BTC as it sets a fresh 2-month low this week. The coin started the week by attempting to break above the September descending price channel at 0.072 BTC. Unfortunately, it could not break the channel and ended up rolling over into the September support at around 0.068 BTC.
On Wednesday, ETH fell beneath a long-term rising trend line as it slipped beneath the 0.068 BTC support and continued beneath the 100-day MA. ETH fell until additional support was found at 0.0643 BTC (.618 Fib). It rebounded from there yesterday, but the market struggled to break 0.0667 BTC.
Looking ahead, the first resistance lies at 0.0667 BTC. This is followed by 0.0691 BTC, 0.07 BTC (50-day MA), 0.0733 BTC, and 0.0765 BTC (beraish .786 Fib).
On the other side, the first support lies at 0.0643 BTC (.618 Fib). This is followed by 0.0632 BTC (downside 1.618 Fib Extension), 0.062 BTC (200-day MA), and 0.06 BTC.
Ripple
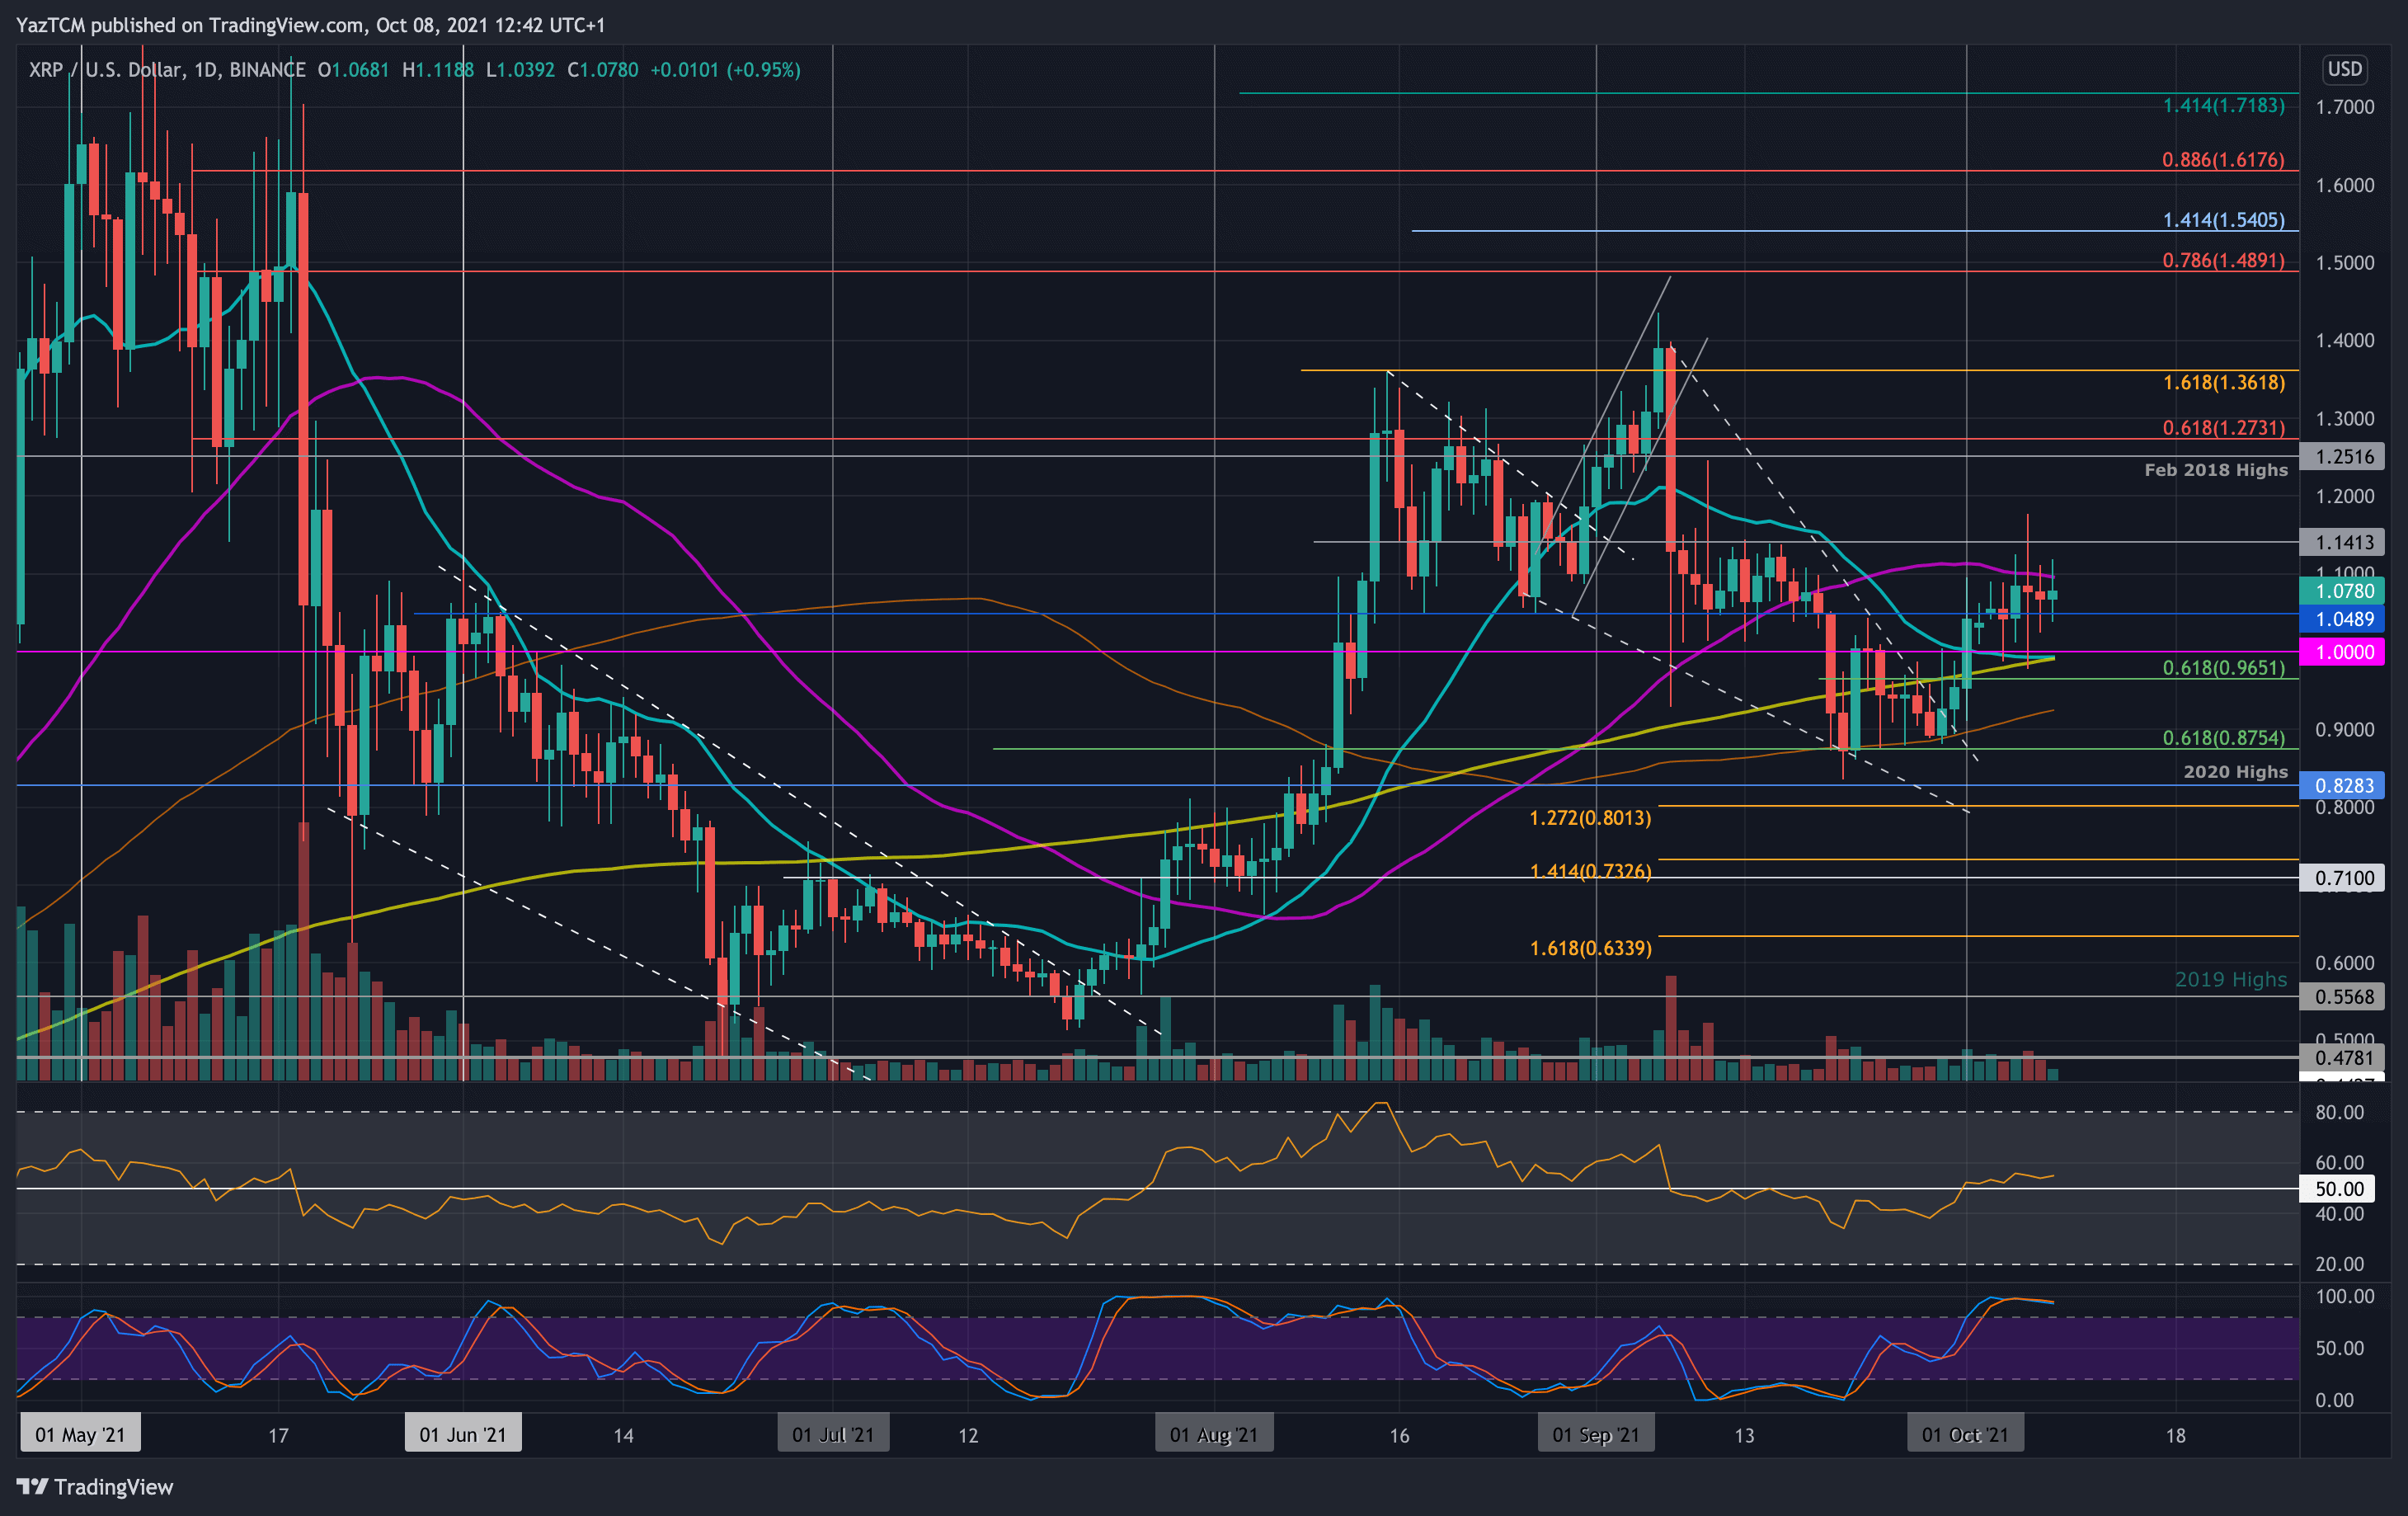
XRP is up by a smaller 13% this week as the cryptocurrency breaks above $1.00 to meet $1.07. XRP broke above a descending wedge formation at the start of October as it continued to break above the 20-day MA and pass $1.00.
Throughout this week, XRP has slowly ground higher above $1.05 but has failed to really break resistance at $1.10, provided by a 50-day MA level.
Looking ahead, the first resistance lies at $1.10 (50-day MA). This is followed by $1.20, $1.25 (Feb 2018 highs), $1.40 (September resistance), and $1.50 (bearish .786 Fib).
On the other side, the first support lies at $1.05. This is followed by $1.00 (20-day MA & 200-day MA), $0.965 (.618 Fib), $0.92 (100-day MA), and $0.875 (.618 Fib).
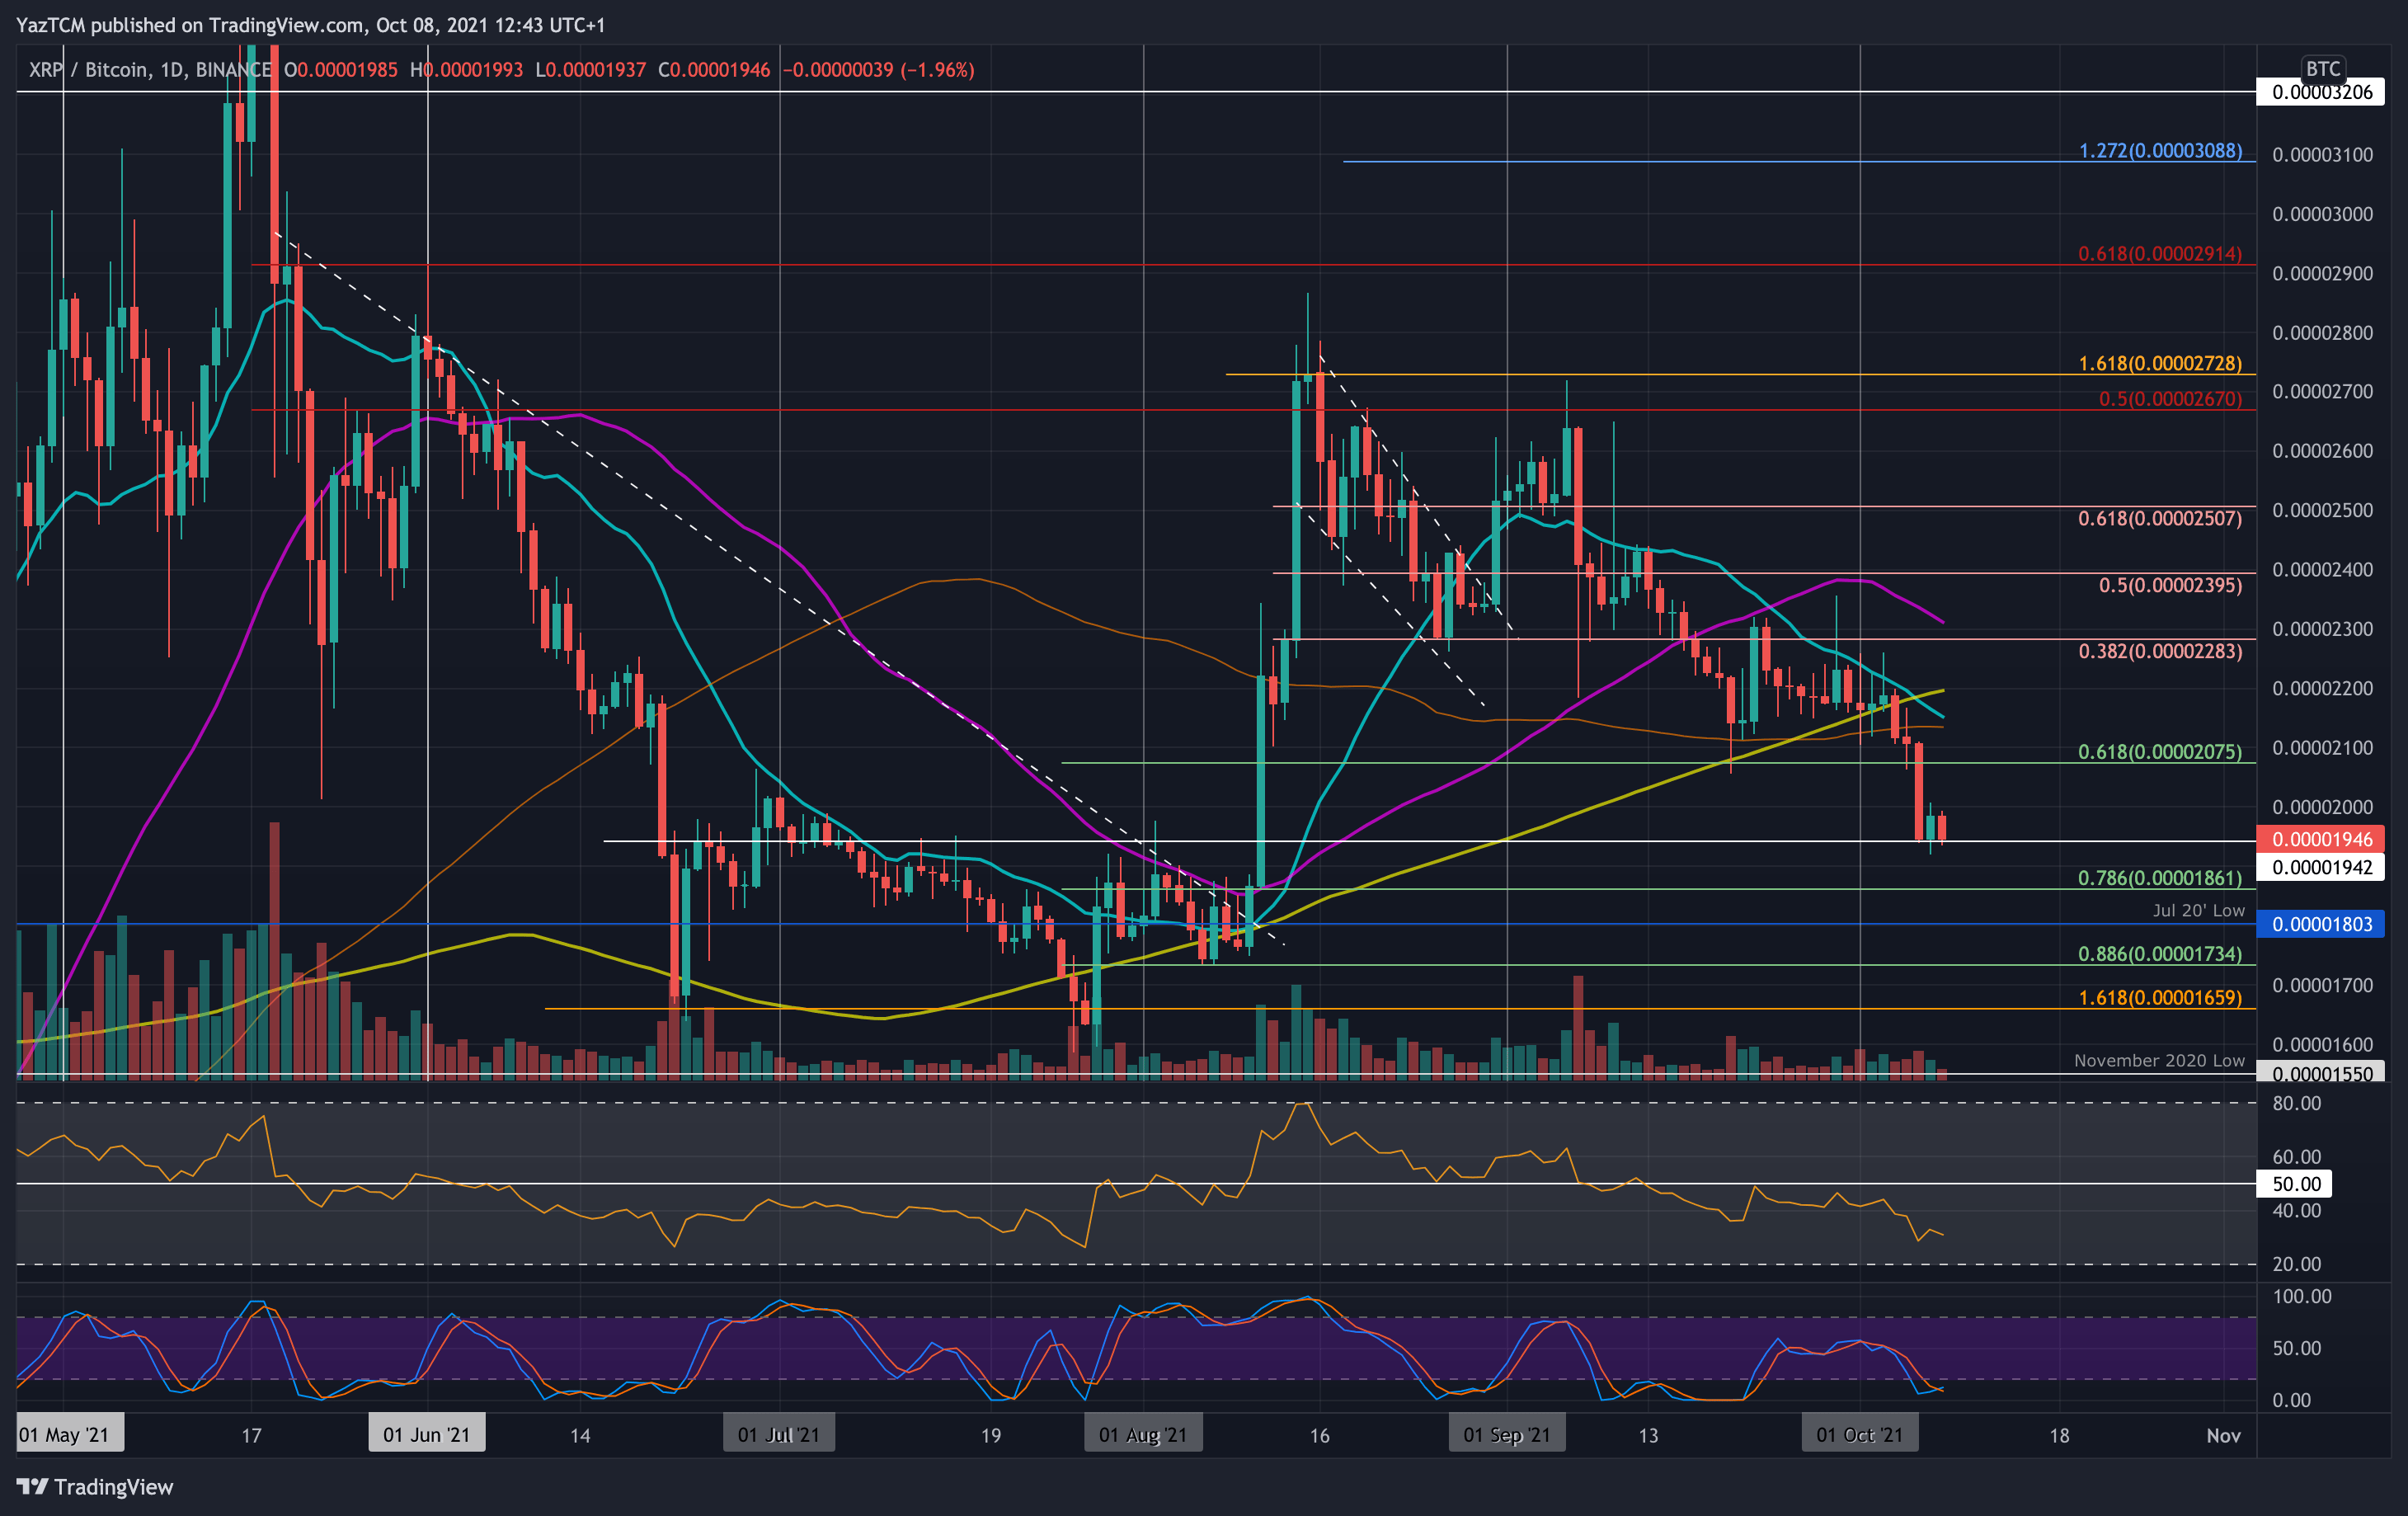
XRP is also struggling heavily against BTC as it crashes beneath the 200-day MA this week to reach support at around 1940 SAT. The coin started the month at around 2200 SAT and started to head lower from there.
On Wednesday, XRP fell beneath 2100 SAT and continued below 2000 SAT until support was found at 1940 SAT, which is resistance established in July 2021.
Looking ahead, if the bears push beneath 1940 SAT, the first support lies at 1860 SAT (.786 Fib). This is followed by 1800 SAT (July 2020 low), 1735 SAT (.886 Fib), and 1660 SAT (downside 1.618 Fib Extension).
On the other side, the first resistance lies at 2000 SAT. This is followed by 2100 SAT, 2200 SAT (200-day MA), and 2300 SAT (50-day MA).
Cardano
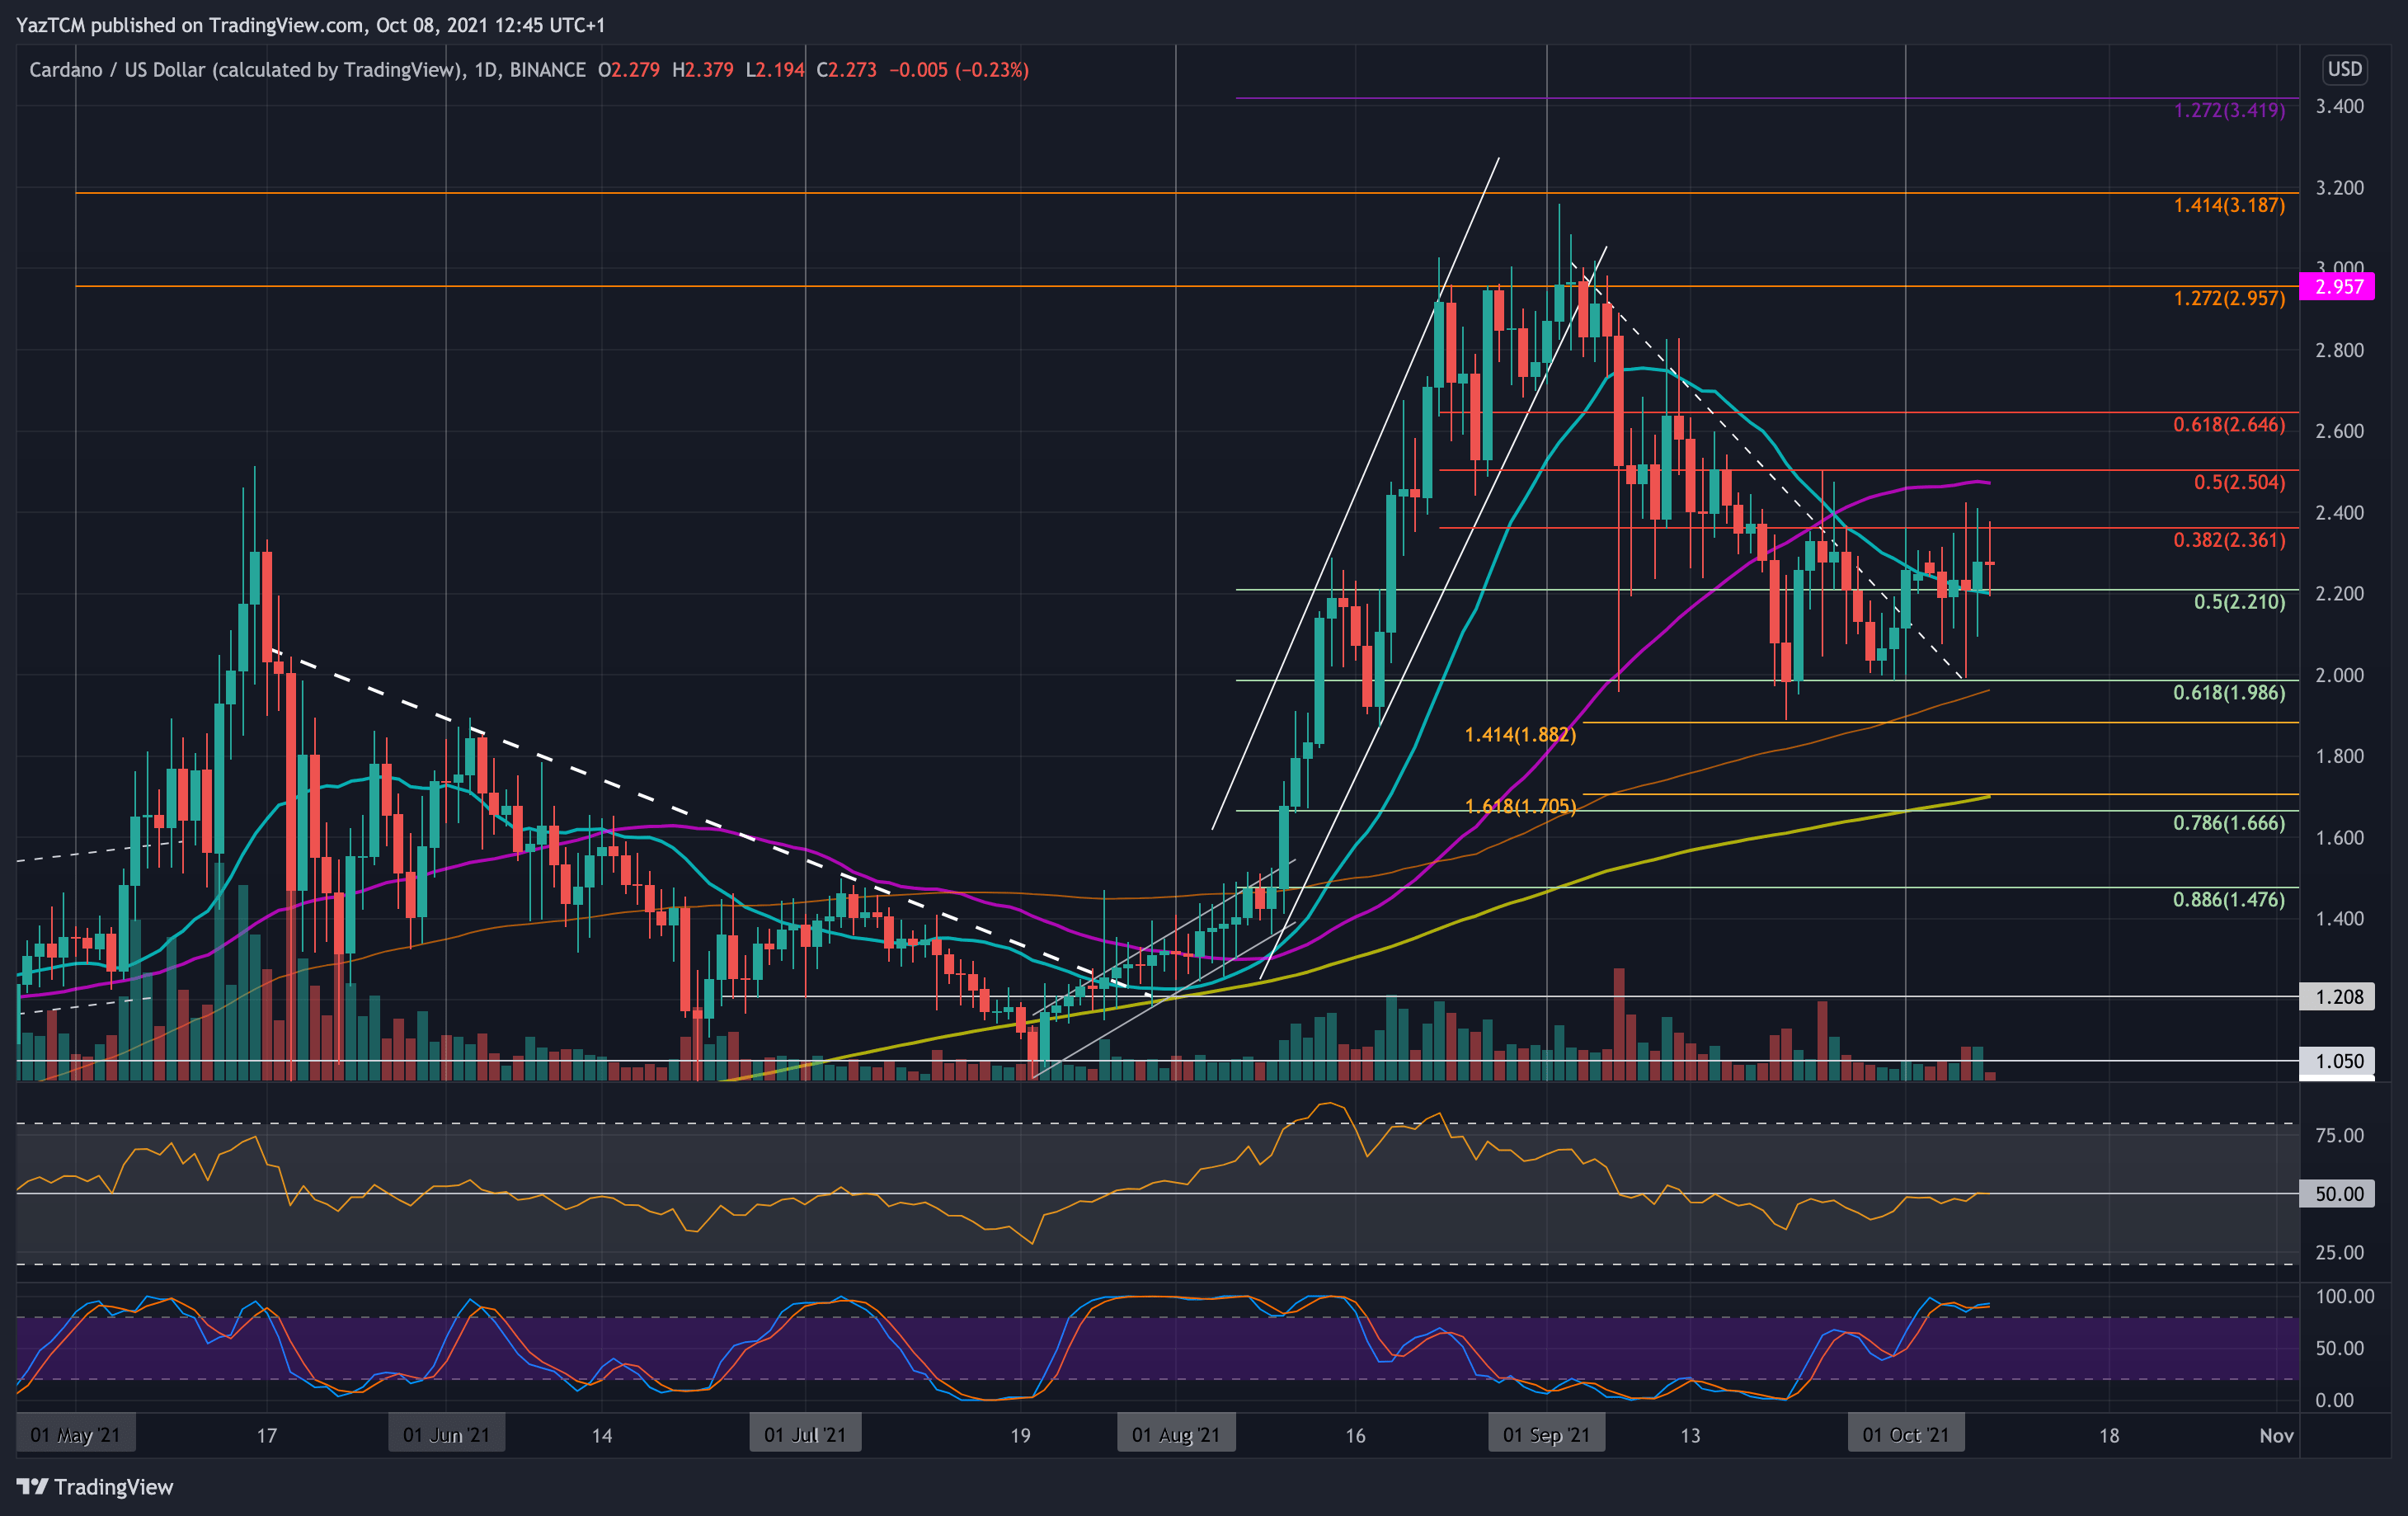
Cardano is up by a small 7% this week as the coin battles to remain above the 20-day MA level. ADA had found support at $2 toward the end of September and rebounded from there as October started, which allowed ADA to break the September descending trend line.
Over the week, ADA has battled to hold above the 20-day MA and struggled to break resistance at around $2.40. It has used $2.20 (.5 Fib & 20-day MA) as support all week but can’t seem to get anywhere above $2.40.
Looking ahead, the first resistance lies at $2.40. This is followed by $2.50 (bearish .5 Fib & 50-day MA), $2.65 (bearish .618 Fib), and $2.80.
On the other side, the first support lies at $2.20 (50-day MA & .5 Fib). This is followed by $2.00 (.618 Fib & 100-dat MA), $1.88 (downside 1.414 Fib & September low), and $1.80.
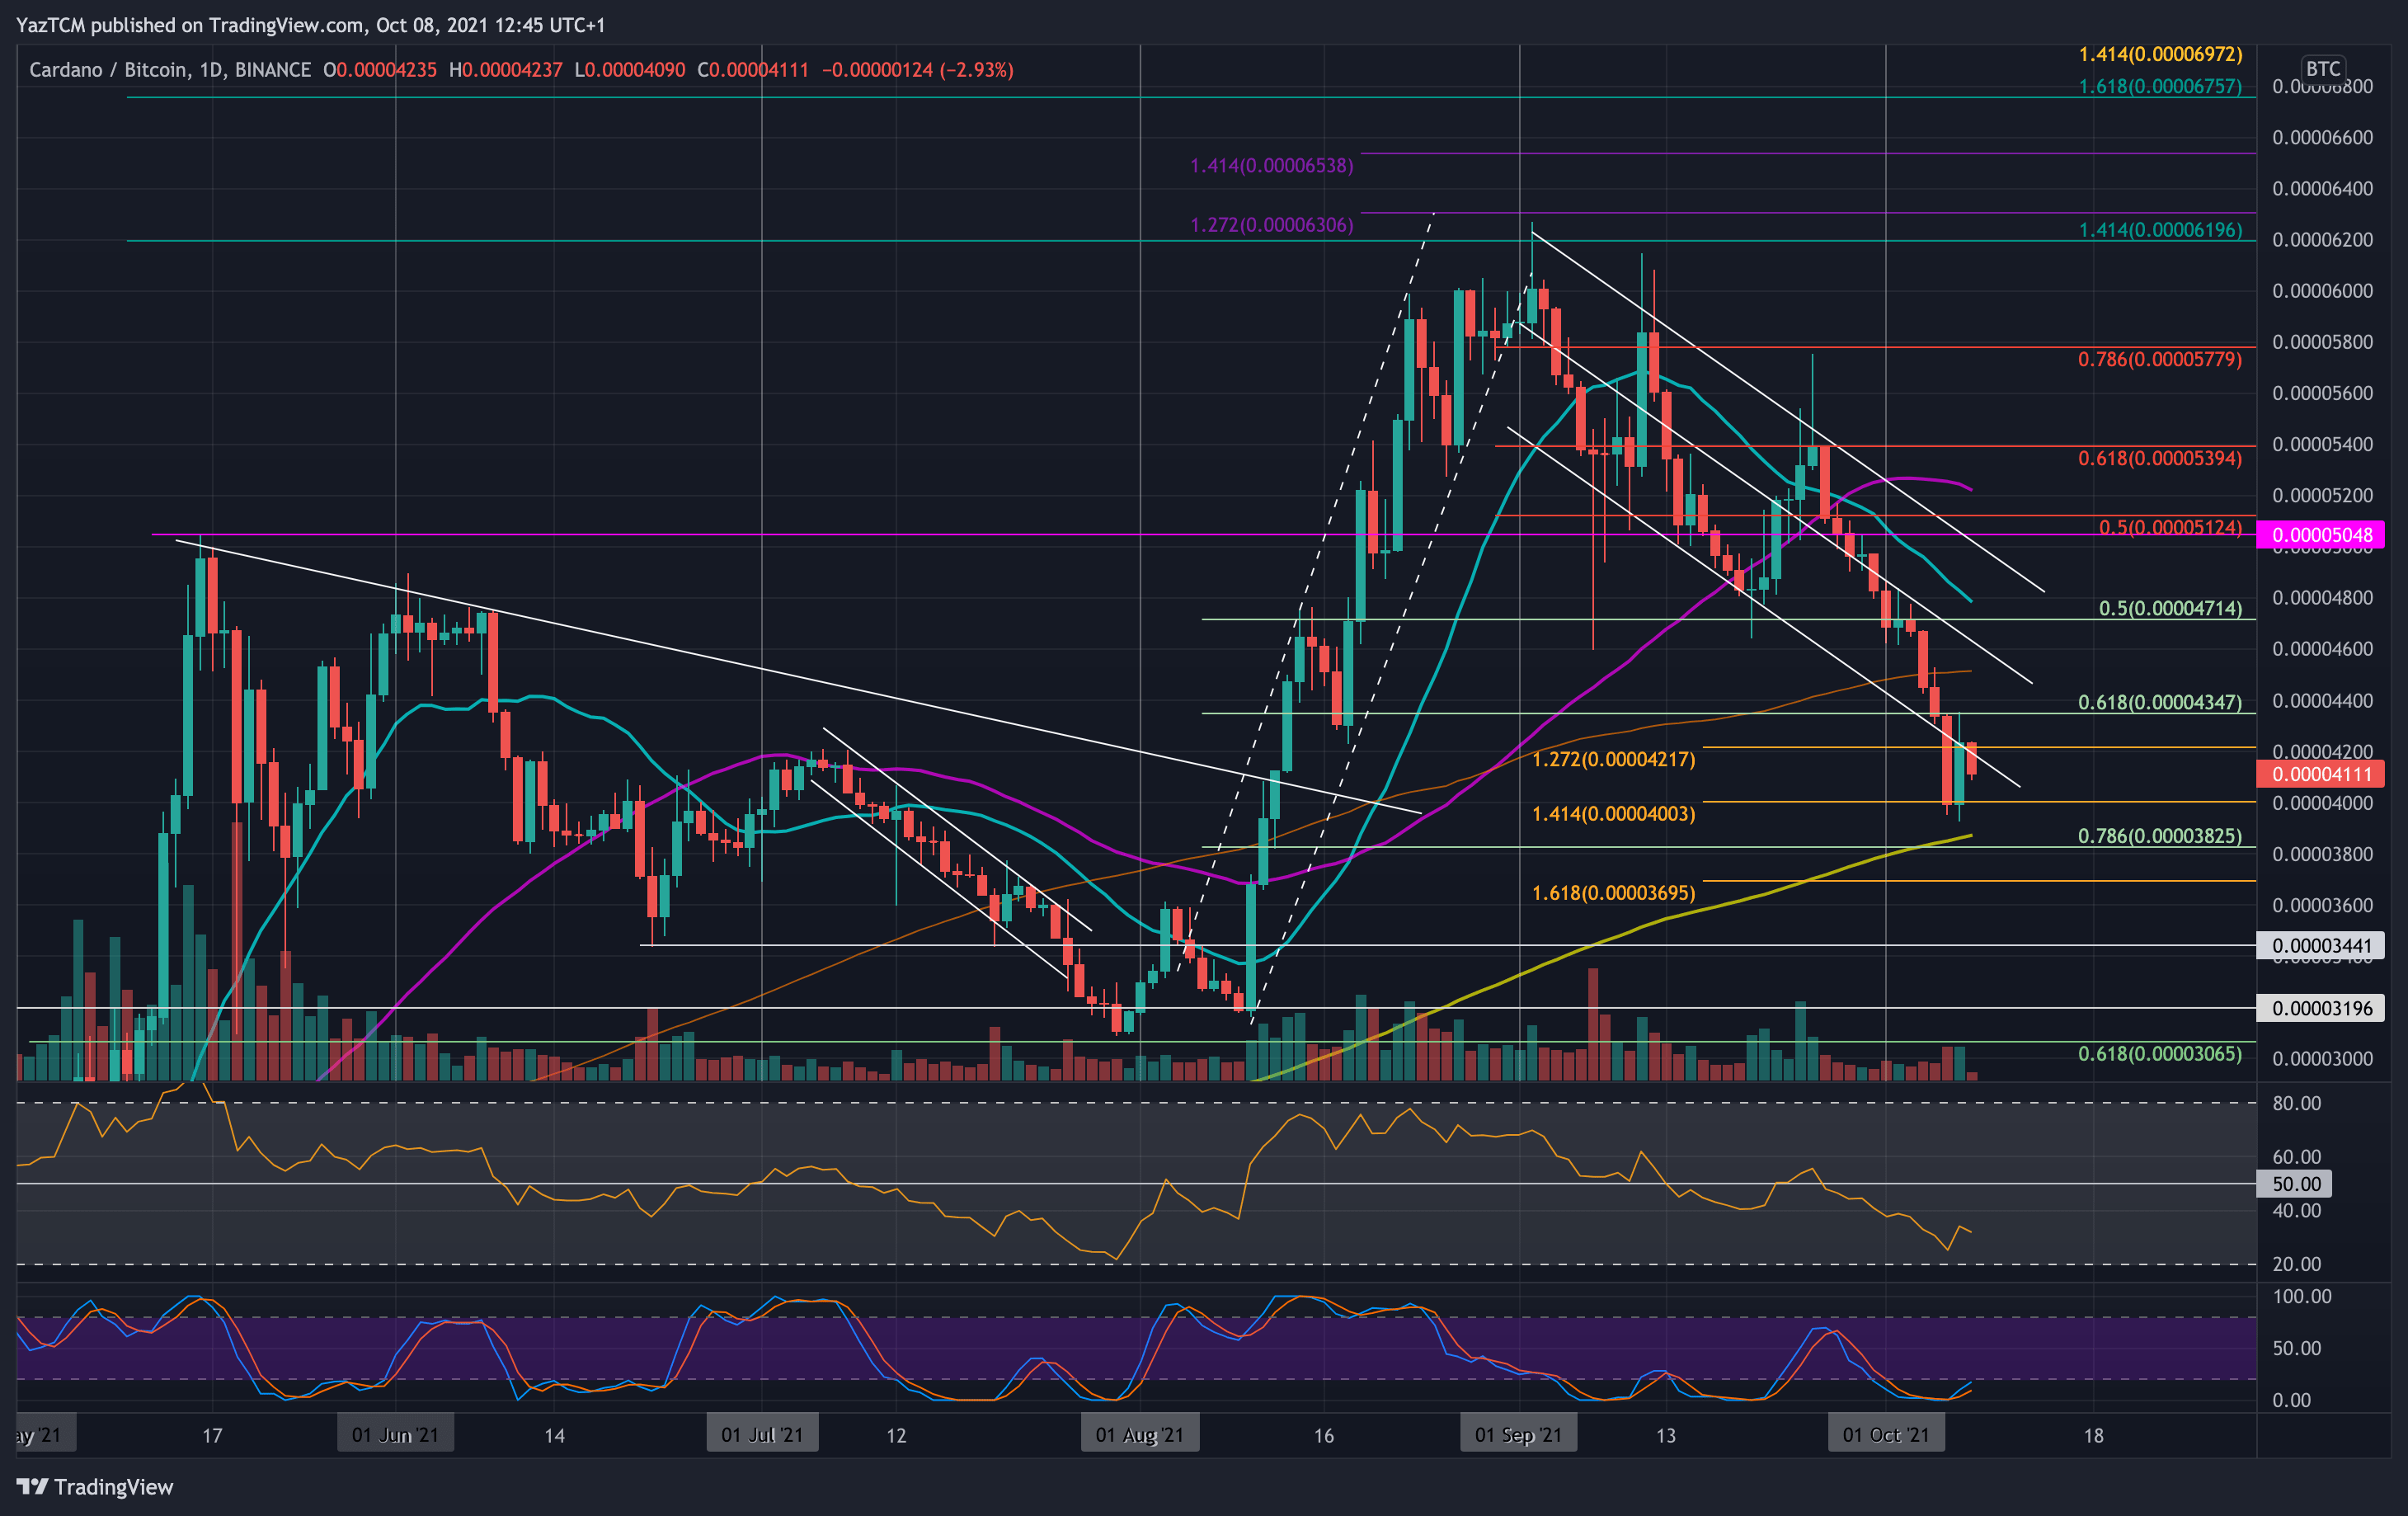
Against BTC, ADA is struggling as it falls beneath a descending price channel this week. ADA started the month against BTC at around 4800 SAT and started to head lower from there. On Wednesday, ADA fell beneath the price channel and continued lower until support was met at 4000 SAT (downside 1.414 Fib Extnesion).
Looking ahead, the first support lies at 4000 SAT. This is followed by 3825 SAT (200-day MA & .786 Fib), 3695 SAT (downside 1.618 Fib), 2600 SAT, and 3440 SAT.
On the other side, the first resistance lies at 3450 SAT. This is followed by 4500 SAT (100-day MA), 4715 SAT, 4800 SAT, and 5000 SAT.
Polkadot
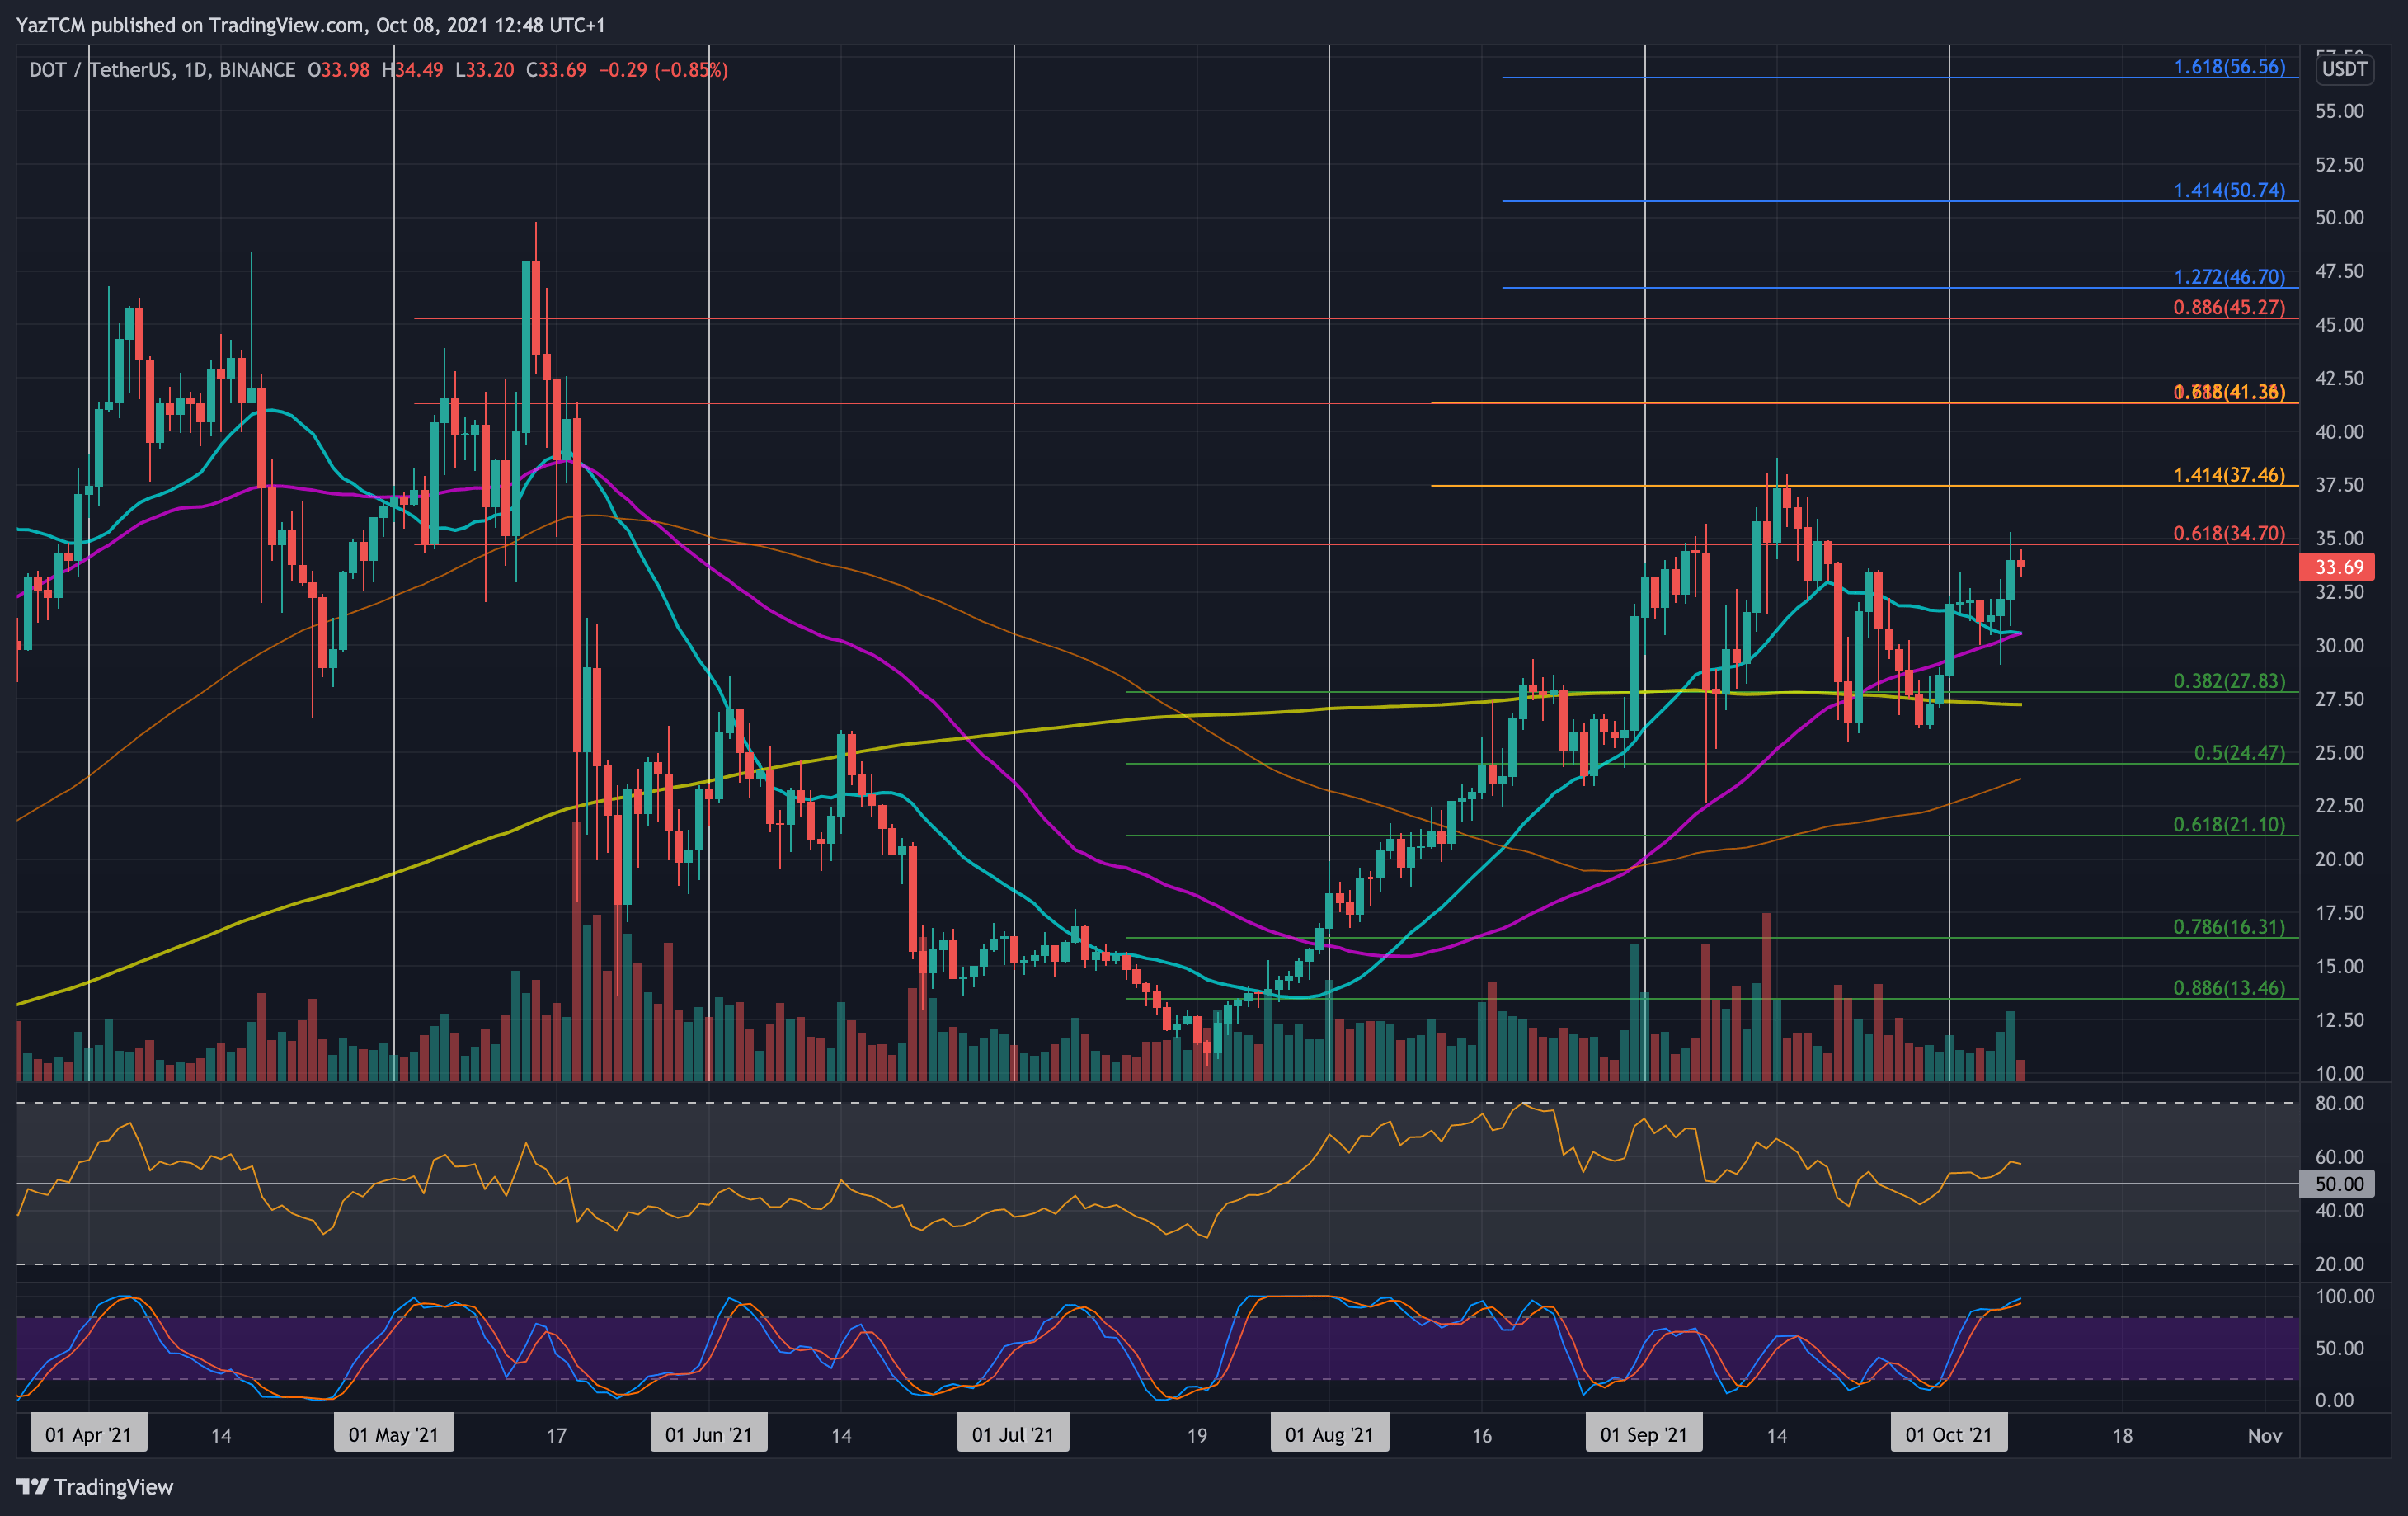
DOT is up by a strong 17.5% this week as the coin currently sits at around $34. The cryptocurrency surged above the 50-day MA and the 20-day MA as the month of October started.
From there, ADA struggled to break resistance at $32.50 during the week until yesterday when it surged as high as $35. So long as ADA remains above $30, it should have the ability to close back in on the September highs.
Looking ahead, the first resistance lies at $34.70 (bearish .618 Fib). This is followed by $37.45 (1.414 Fib Extension & Sep highs), $40, $41.35, and $45.
On the other side, the first support lies at $32.50. This is followed by $30 (20-day MA & 50-day MA), $27.80 (.382 Fib & 200-day MA), and $24.50 (.5 Fib).
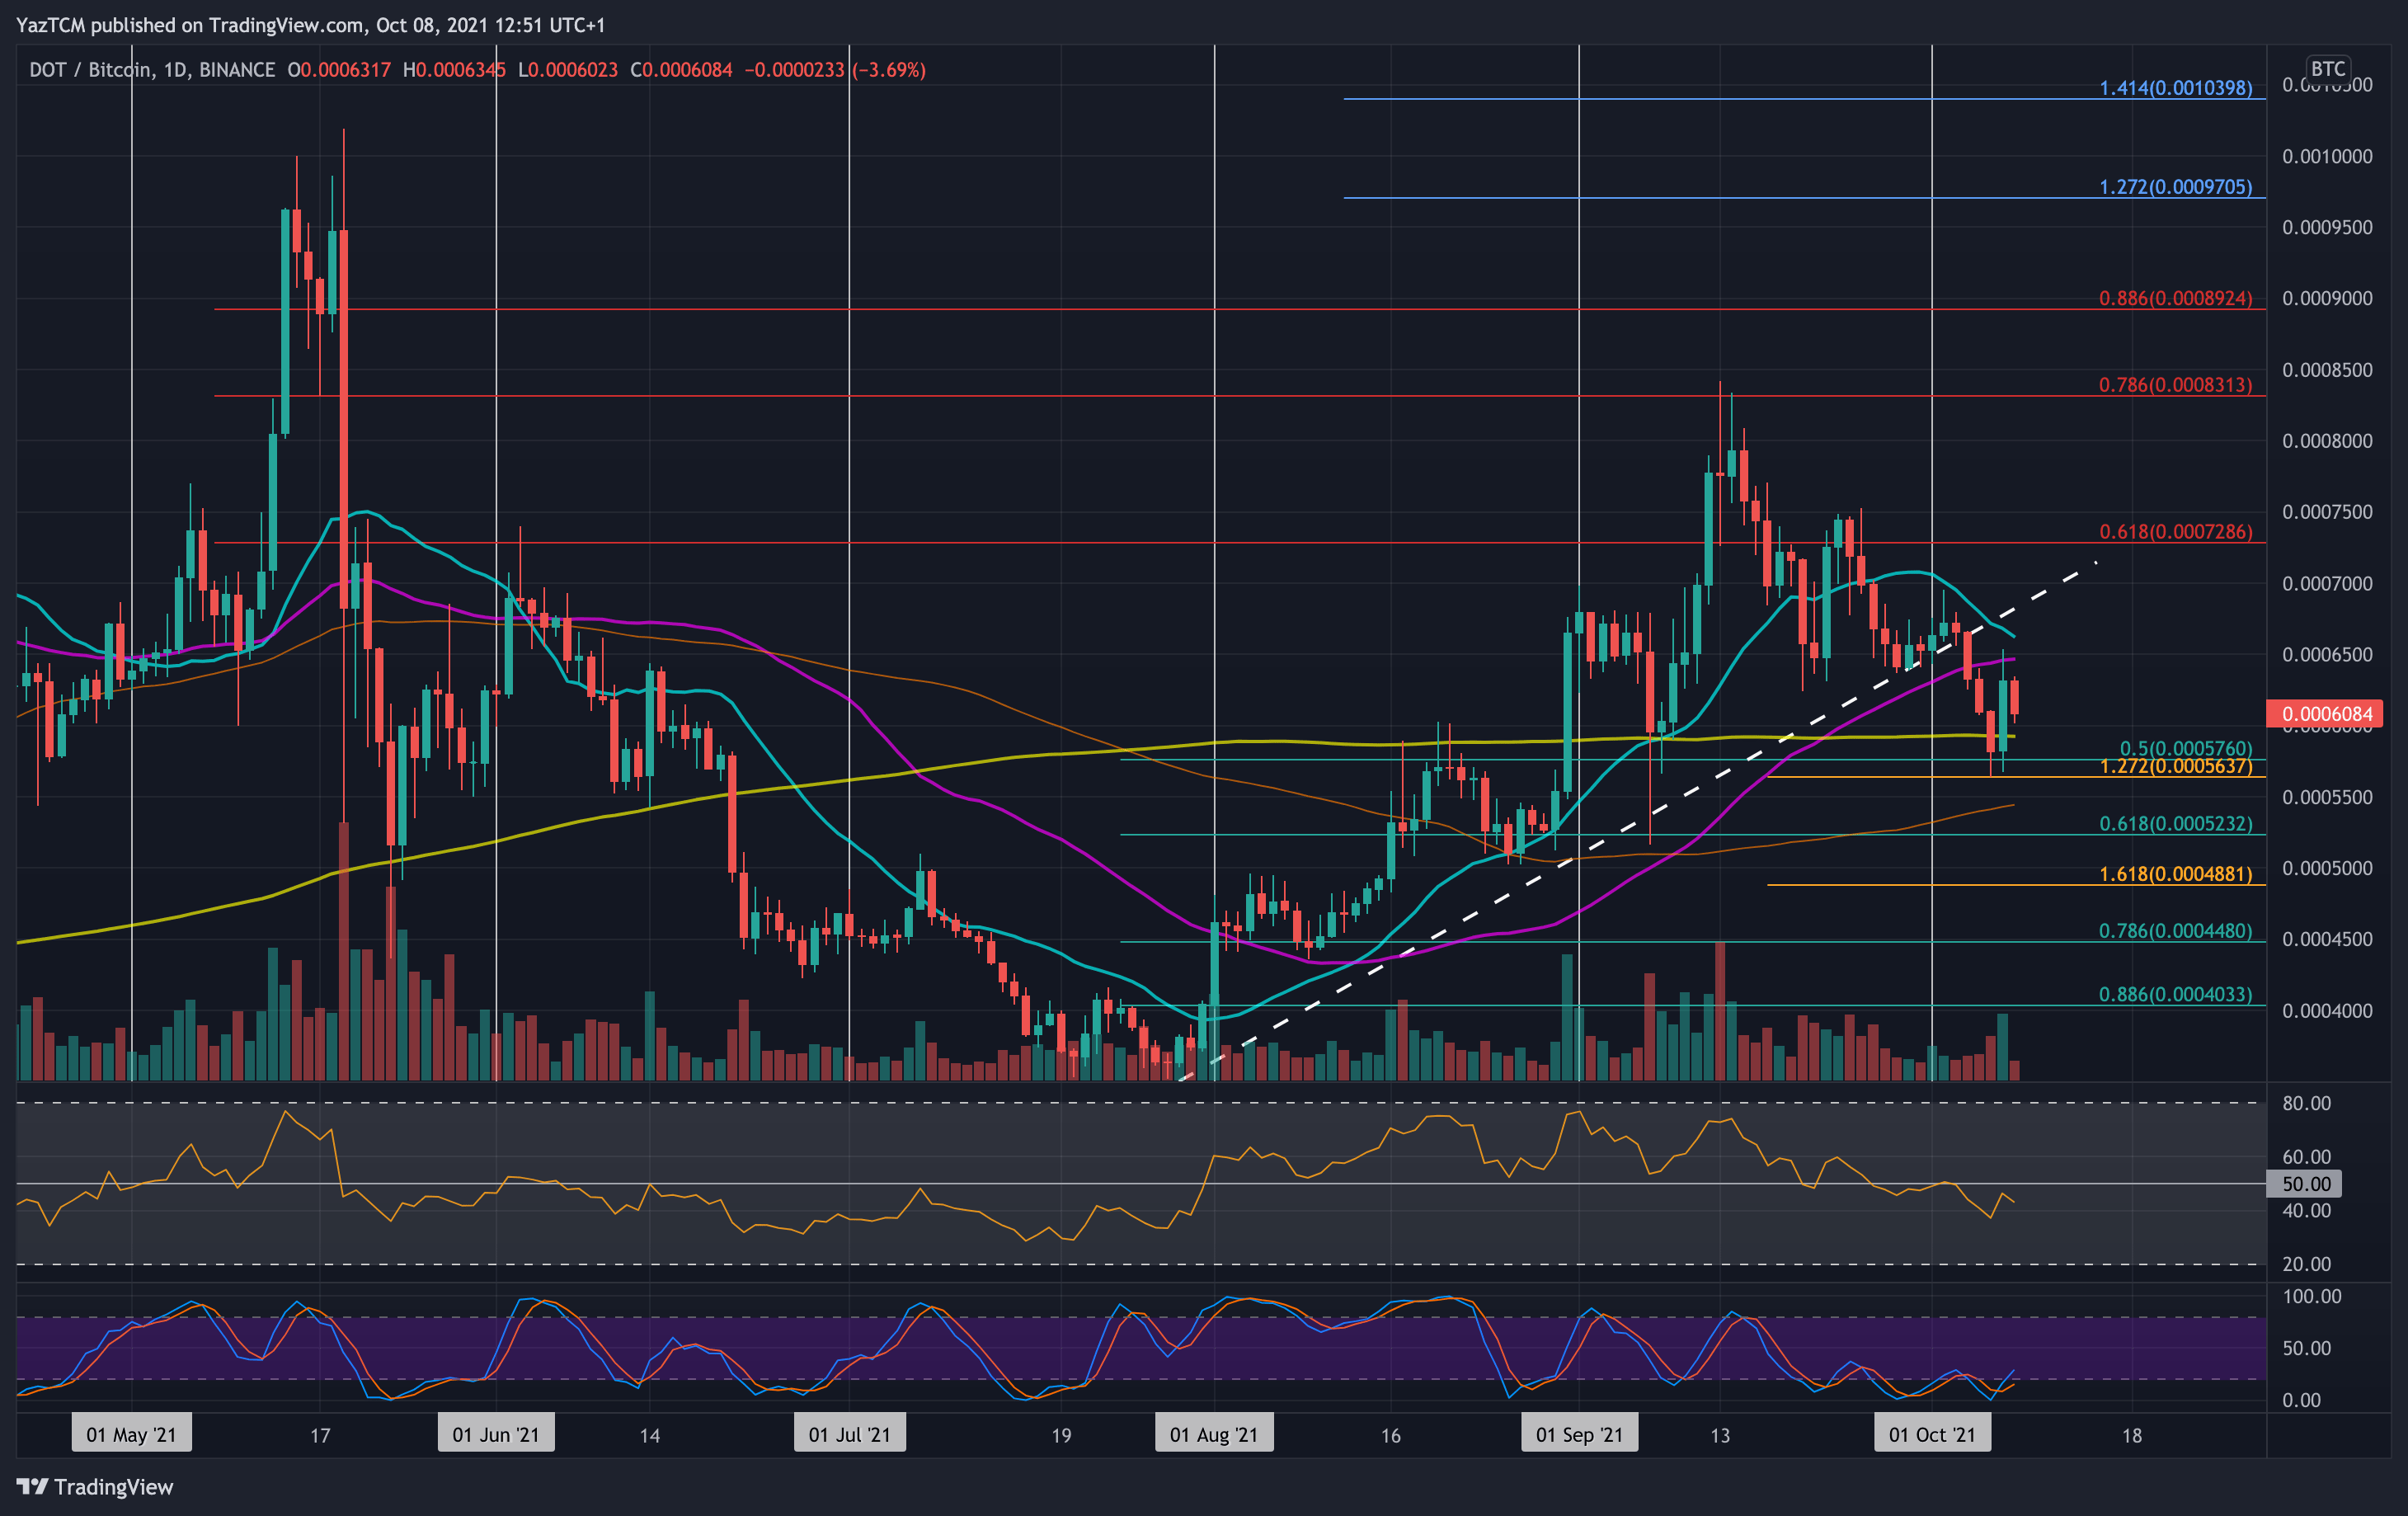
DOT is also struggling against BTC after falling beneath a two-month-old falling trend line this week. The coin fell beneath the trend line at the start of the week and continued to head lower during the week until support was found at 5760 SAT (.5 Fib).
DOT did rebound from 5760 SAT yesterday but is struggling to climb above resistance at the 50-day MA around 6500 SAT.
Looking ahead, the first support lies at 6000 SAT (200-day MA). This is followed by 5500 SAT (100-day MA), 5230 SAT (.618 Fib), 5000 SAT, and 4880 SAT (downside 1.618 Fib Extension).
On the other side, the first resistance lies at 6500 SAT (50-day MA). This is followed by 7000 SAT, 7285 SAT (bearish .618 Fib), 7500 SAT, and 8000 SAT.