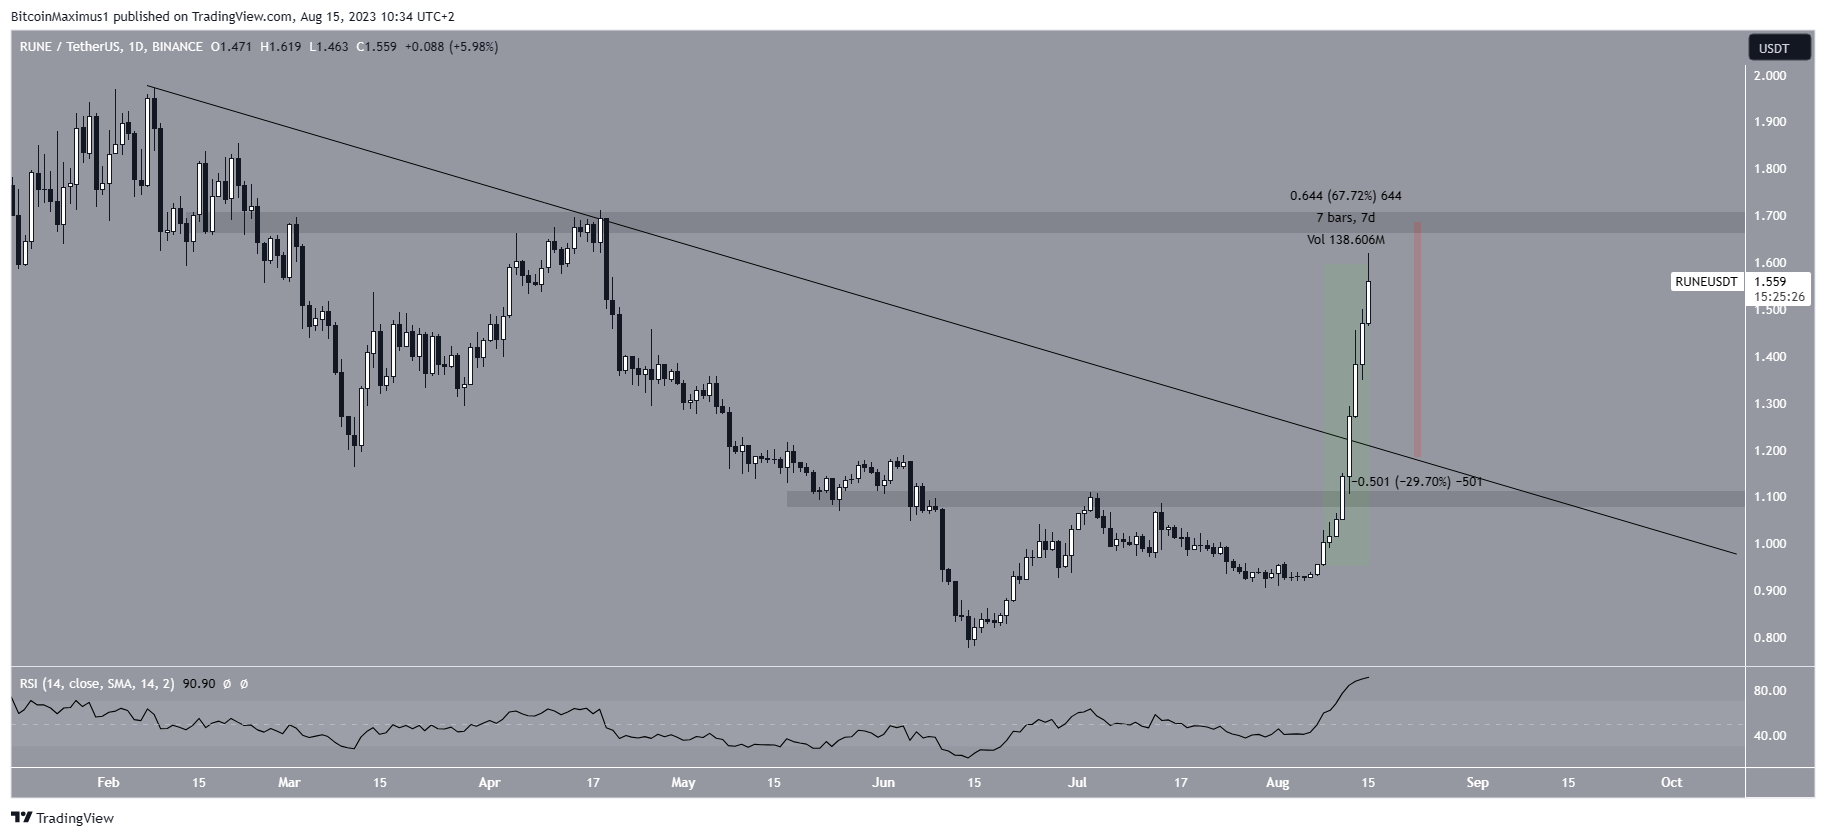
The THORChain (RUNE) price has increased nearly 70% over the last seven days, breaking out from an important diagonal resistance line.
Readings from the weekly and daily timeframes both support the continuing increase to a new yearly high and beyond.
RUNE Price Approaches Yearly High After Breakout
The RUNE price has increased since reaching a low of $0.78 on June 14. While the increase was initially gradual, the price created a higher low at the beginning of August and then accelerated its rate of increase.
Over the past 7 days, the RUNE price has increased by nearly 70%.
Check out the 9 Best AI Crypto Trading Bots to Maximize Your Profits.
The increase began shortly after a positive report by Delphi Digital, which stated that its fundamentals and user traction are strengthening.
As a result of the increase, RUNE broke out from a long-term descending resistance line on August 12. The price is now approaching the $1.70 area, which is the final resistance before the yearly high region of $1.95.

The daily RSI supports the ongoing increase. When evaluating market conditions, traders use the RSI as a momentum indicator to determine if a market is overbought or oversold and to decide whether to accumulate or sell an asset.
If the RSI reading is above 50 and the trend is upward, bulls still have an advantage, but if the reading is below 50, the opposite is true. The indicator is above 50 and moving upwards, both signs of a bullish trend.
However, a rejection from the $1.70 area can lead to a decrease that would validate the previous descending resistance line. The line is currently at $1.20, a drop of 30% measuring from the current price.
Looking to be profitable? Learn How To Make Money in a Bear Market.
RUNE Price Prediction: Is This the Beginning of the Bullish Trend?
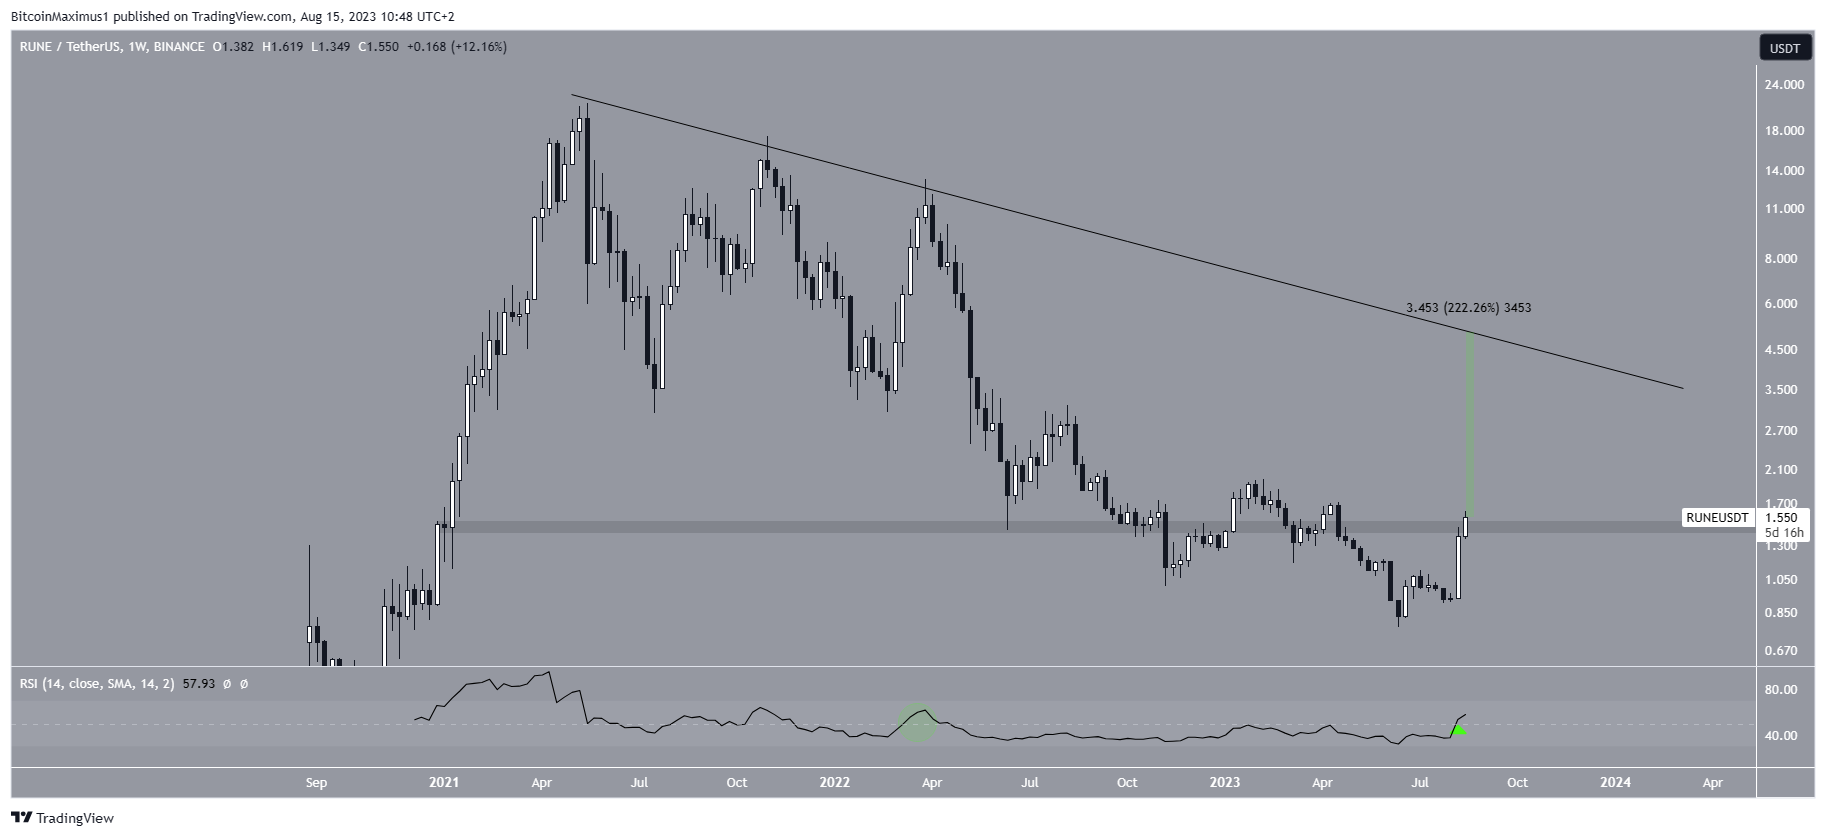
The technical analysis from the weekly timeframe aligns with that from the daily one. The reasons for this mostly relate to the price action.
Currently, the RUNE price is in the process of closing above the long-term $1.50 resistance area. This is a crucial area since it has intermittently acted as both resistance and support since the beginning of 2021. Therefore, closing above it will be a decisive bullish sign confirming the daily timeframe’s bullish readings.
Furthermore, the weekly RSI has just increased above 50 (green icon). This is the first time the RSI moves above 50 since March 2022 (green circle).
If the RUNE price closes above $1.50, it can increase to a long-term resistance line at $5. This is an increase of 220%, measuring from the current price.

Despite this bullish RUNE price prediction, failure to clear the $1.70 resistance area will mean that the trend is still bearish. In that case, the RUNE price can fall by 30% and reach the previous descending resistance line at $1.20.
Check out these Top 11 Crypto Communities To Join in 2023
For BeInCrypto’s latest crypto market analysis, click here.
 beincrypto.com
