
BeInCrypto looks at five altcoins that increased the most in this week’s crypto market, specifically from August 4 to 11.
The term altcoin refers to cryptocurrencies other than Bitcoin (BTC). These bullish altcoins have stolen the crypto news and cryptocurrency market spotlight this week as the biggest gainers:
- Shiba Inu ($SHIB) price increased by 19.38%
- THORChain ($RUNE) price increased by 16.59%
- $OKB price increased by 14.50%
- dYdX ($DYDX) price increased by 12.91%
- Synthetix Network ($SNX) price increased by 8.92%
Shiba Inu ($SHIB) Price Leads Altcoin Gainers
The $SHIB price has increased since falling to a new yearly low of $0.0000054 on June 10. The increase has been swift, and the price reclaimed the $0.0000080 horizontal area on July 28. Six days later, the price moved above the support line of a previous long-term symmetrical triangle.
There are both signs that the previous breakdown was illegitimate, and the trend is still bullish.
Stay ahead in the game with $SHIB price forecasts.
If the upward movement continues, the price can reach the triangle’s resistance line at $0.0000113. This would be an increase of 12%, measuring from the current price of $0.000010.
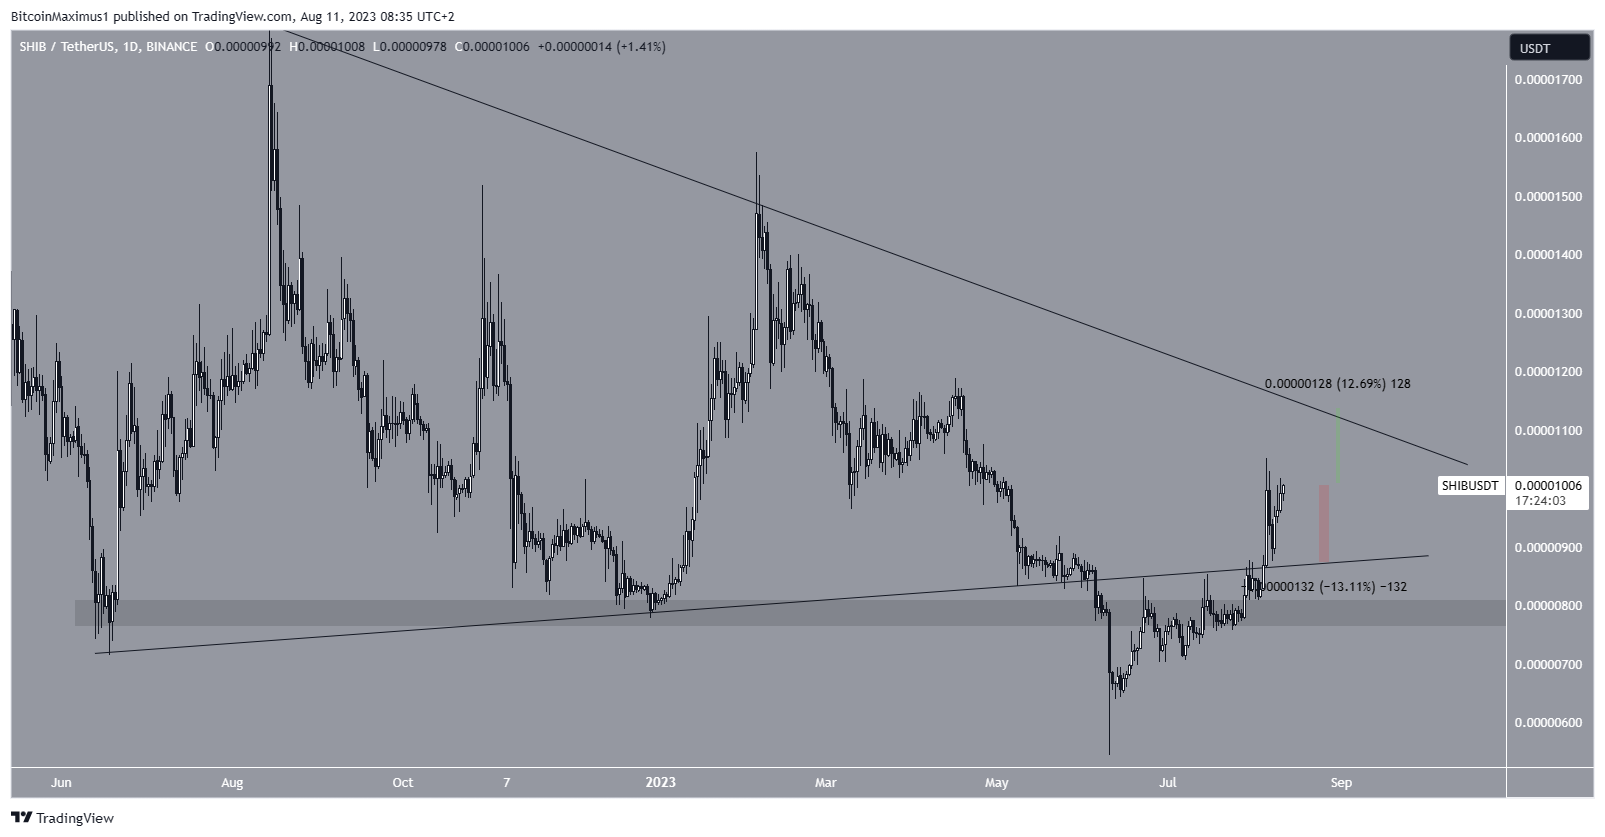
However, if a decrease occurs, the $SHIB price could drop 13% to the triangle’s support line at $0.0000090.
THORChain ($RUNE) Price Increases After Higher Low
The $RUNE price has increased since June 14. The price created a higher low on July 30 and accelerated its rate of increase afterward. The price is now trading inside the $1.10 horizontal resistance area. This is an important area since it had previously provided support. Additionally, it coincides with a long-term descending resistance line that began in February.
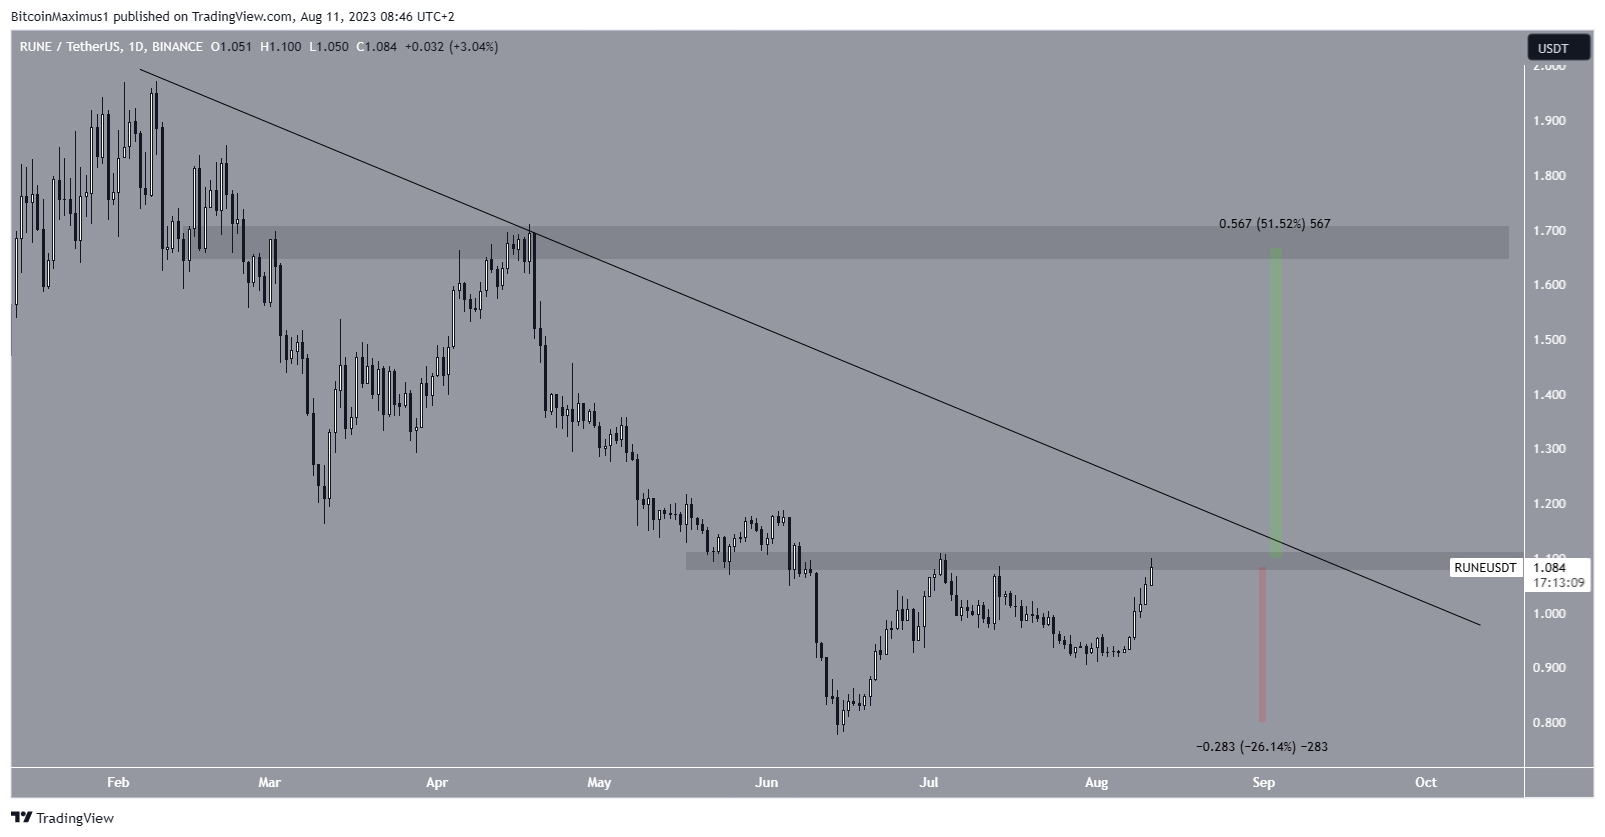
If $RUNE breaks out from the line, it can increase by slightly more than 50% and reach the next resistance at $1.70. However, a 25% drop to the yearly lows will be the most likely scenario if it gets rejected.
Read More: 11 Best Sites To Instantly Swap Crypto for the Lowest Fees
$OKB Price Trades in Continuation Pattern
The $OKB price has traded inside a symmetrical triangle since the beginning of February. The triangle is considered a neutral pattern. However, the pattern usually leads to continuation. Since the triangle transpires after an upward movement, a breakout from it would be the most likely scenario.
If the price breaks out, a 50% increase to the next resistance at $72 will be the most likely scenario. The target is found using the 1.61 external Fib retracement of the most recent downward movement.
This would ultimately culminate in a new all-time high for the altcoin. Currently, the all-time high is $58.66, which it hit in February 2023.
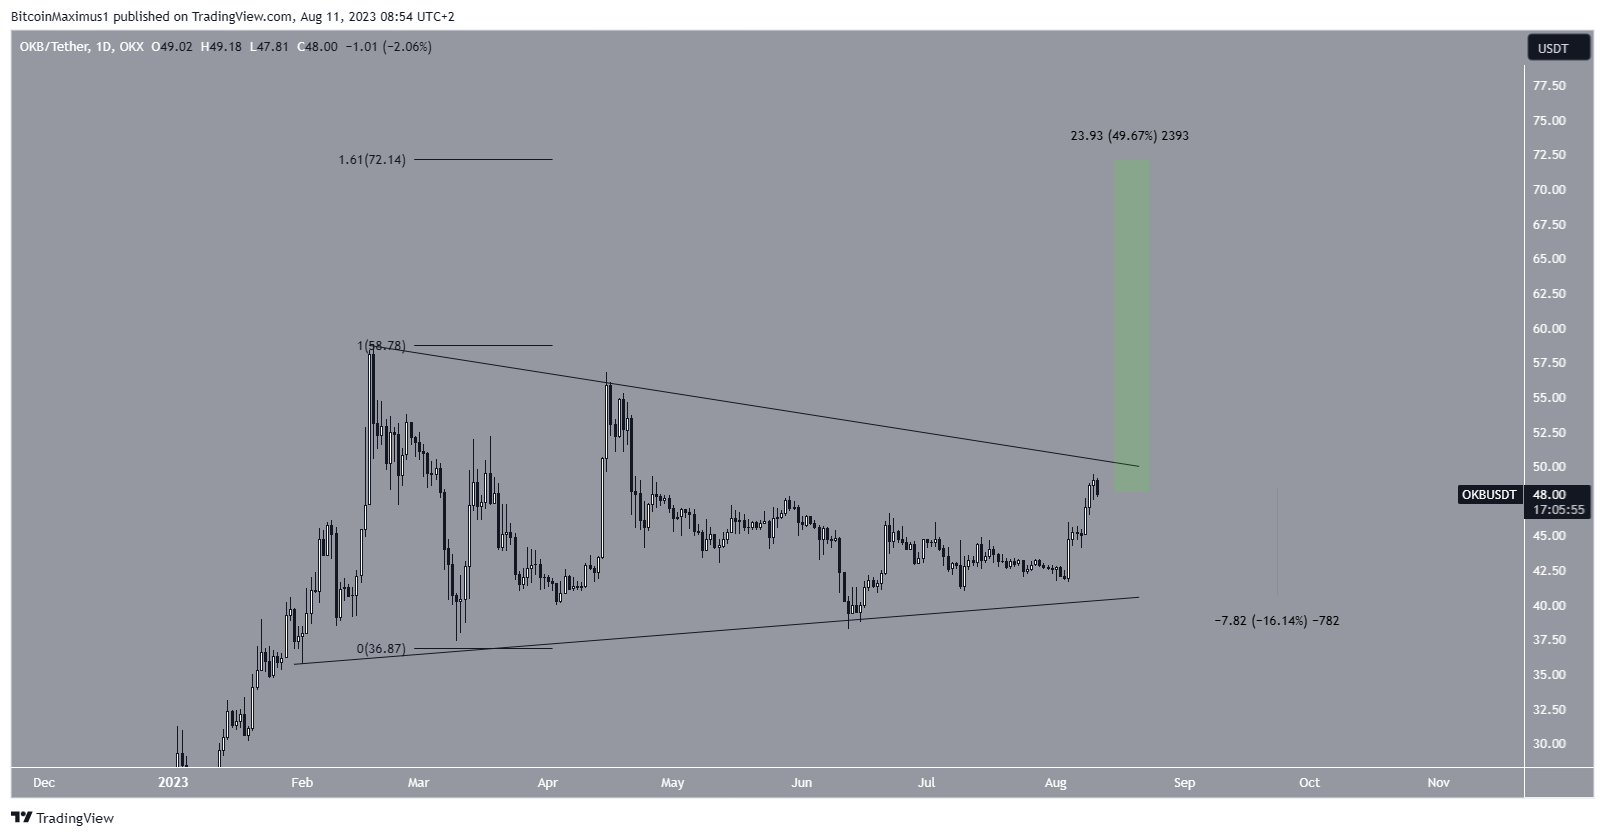
On the other hand, if $OKB gets rejected again, it can fall by 16% to the triangle’s support line at $40.
$DYDX Approaches Resistance Line
The $DYDX price has fallen under a descending resistance line since February. The line caused multiple rejections, the most recent on April 28 (red icon). The resistance line is currently at $2.25, slightly above the current price.
If $DYDX breaks out, it can increase to the next resistance at $3.20, an upward movement of 45% measuring from the current price of approximately $2.16.
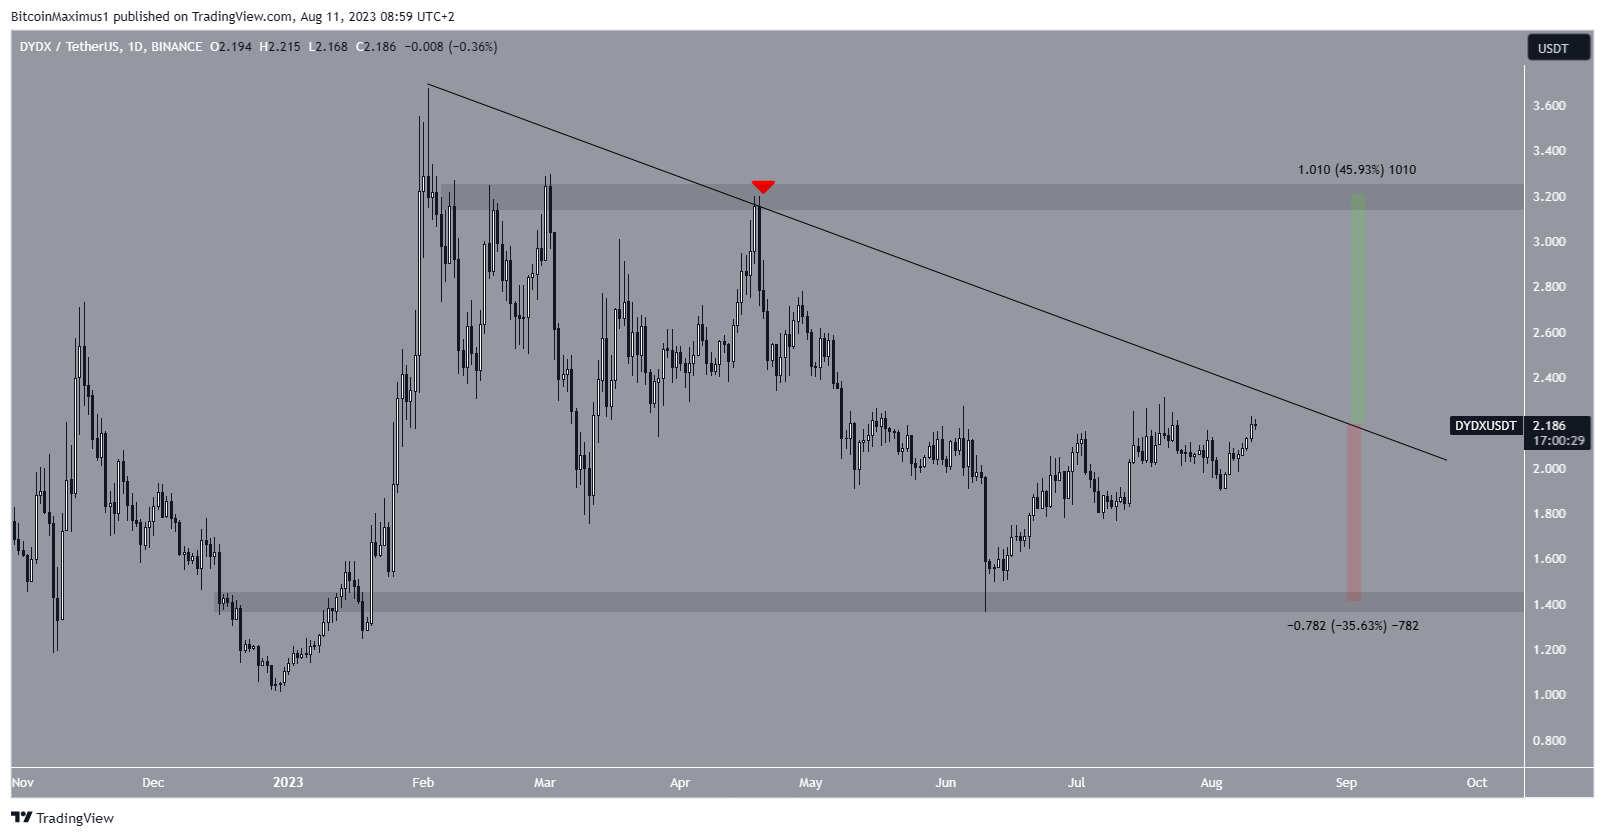
However, a 35% decrease to the $1.40 horizontal support area could occur if the price gets rejected.
Synthetix Network ($SNX) Price Concludes Altcoin Gainers
The $SNX price has fallen under a descending resistance line since the start of March. More recently, the line caused a rejection on July 21 (red icon). This led to a decrease that culminated with a low of $2.35 on August 4.
However, the price regained its footing immediately afterward and reclaimed the $2.50 horizontal area. These deviations are considered bullish signs that often lead to upward movements.
The $SNX price can reach the resistance line at $2.90 if the increase continues. This is an upward movement of 14% measuring from the current price.
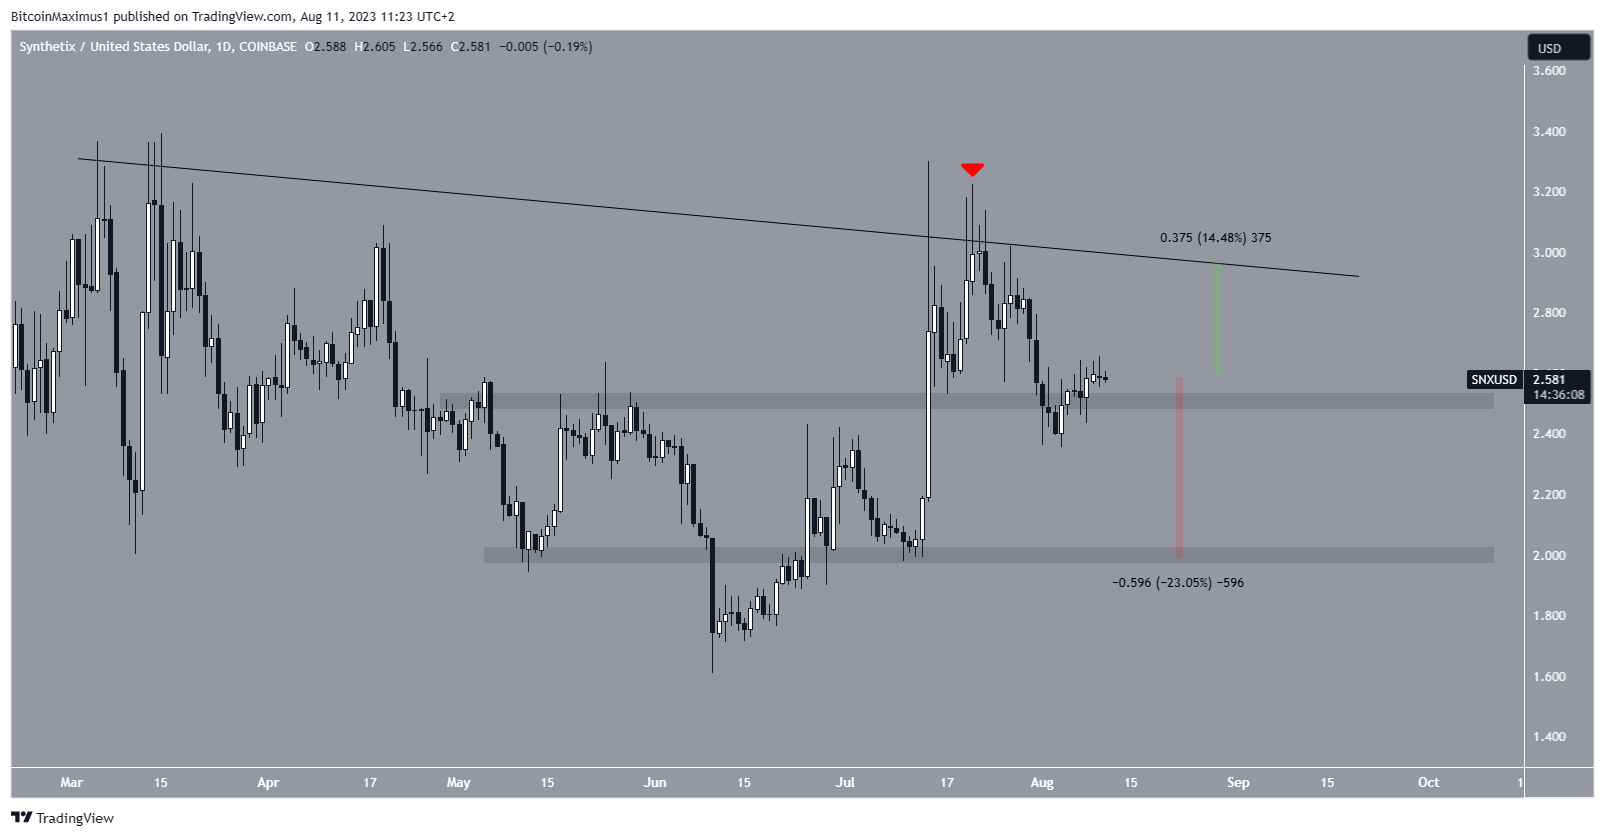
However, if $SNX closes below the $2.50 area, a 23% decrease to the $2 support area will be the most likely price outlook.