Markets have started slowly, with the global market cap recording a 0.28% decrease in a day to take the total cap to $1.17T as of press time. The fear and greed index is also at 51, a neutral position.
Bitcoin (BTC) analysis
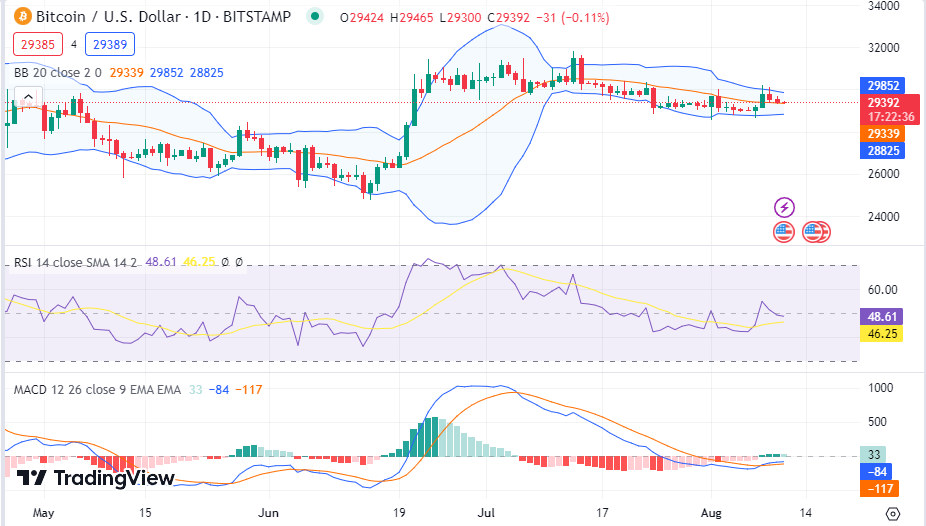
Bitcoin (BTC) has encountered bear activity and is still hovering around $29K as it trades at $29.3K after recording a daily drop of 0.38% and a weekly increase of 0.6%. Bitcoin’s trade volume has dropped by 35% during the same period and is presently at $11.5B.
The Bollinger bands are still converging, indicating that the volatility of Bitcoin is decreasing. The Relative Strength Index (RSI) is still above its average level, showing the effort by bulls for market dominance as the MACD also now moves in the green zone.
Ethereum (ETH) analysis
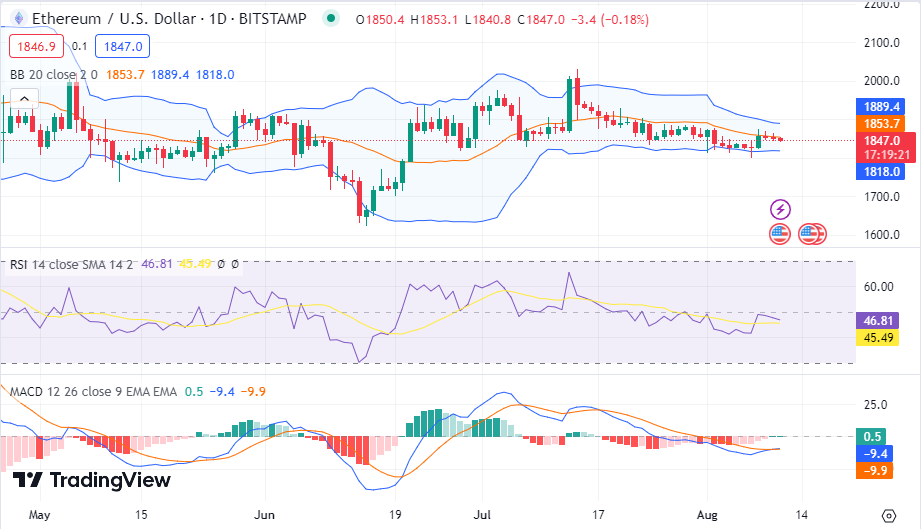
Ethereum (ETH) has also started the week slow, as the asset now sits on losses of 0.2% within a day of trading to take it to $1846 as the trading volume dropped by 31% to take it to $3.75B as of press time. ETH’s volatility levels are also slowly decreasing as the Bollinger bands maintain a relatively close distance.
The RSI indicator moves above its average line as the asset’s bears push for a crossover below. The MACD indicator moves below at a neutral position as bulls and bears struggle for dominance.
Solana (SOL) analysis
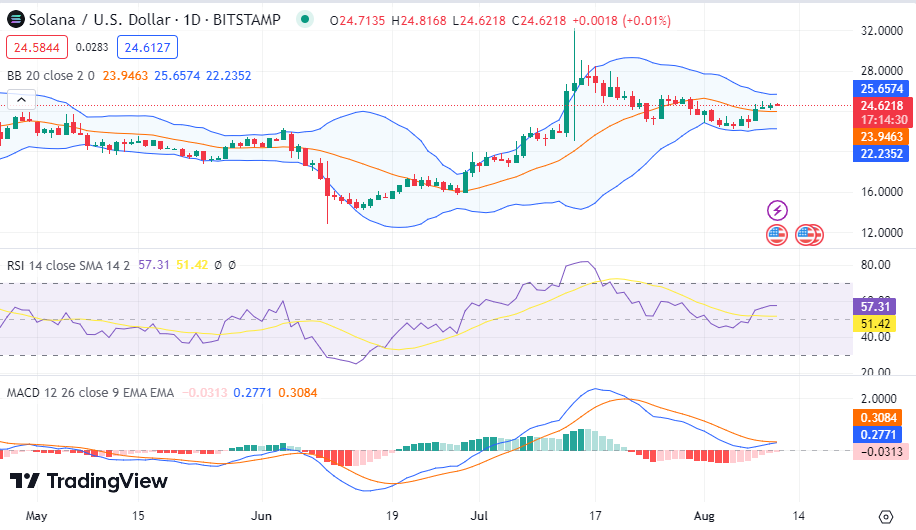
Despite today’s market dip, Solana (SOL is displaying some bull activity as the asset trades 1.29% above its previous 24-hour price. It now holds a spot price of $24.60, with the trading volume recording a drop of 19.8% within a day of trade to take it to $348M
SOL’s volatility levels are also low as the Bollinger bands maintain a relatively close distance from each other. At the same time, the RSI indicator moves above its average line, indicating a bullish momentum on Solana. The MACD is also approaching a shift to the green zone as bulls push for dominance.
Optimism (OP) analysis
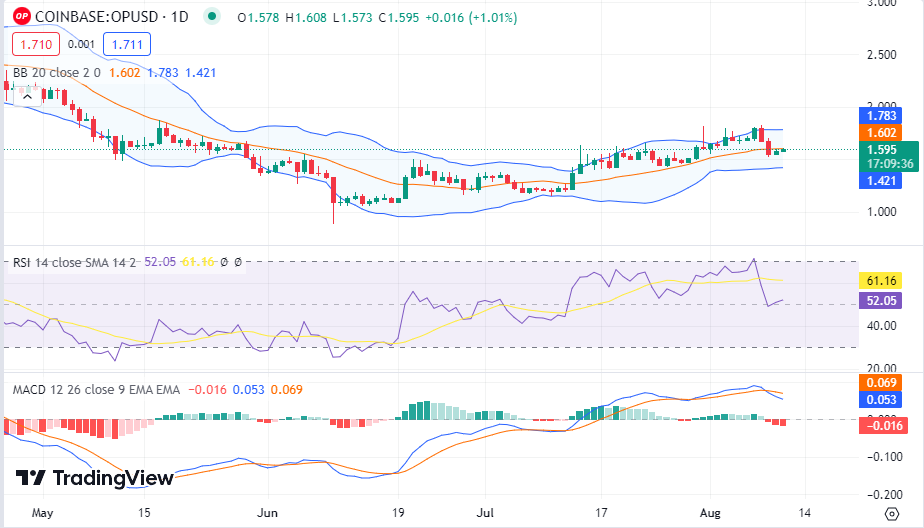
Optimism is also having a tremendous session today as the asset now sits on gains of 2.25% within a day. The asset now holds a spot price of $1.6 as of press time, with the trading volume on a 40% drop within the same period.
OP’s volatility levels are currently low as the Bollinger bands maintain a relatively closer distance from each other. At the same time, the RSI moves below the average line showing a great struggle between bulls and bears for Dominance on optimism.
Other analysis
Orchid (OXT) also has a tremendous session as the asset boasts an 11.6% gain within a day of trade, as the asset now trades at $0.09133. Akash Network (AKT) trades at 11% above its previous 24-hour price with a spot price of $1.0055. Bancor (BNT) has, however, failed to post gains as it makes trends with losses of 6% from its previous 24-hour valuation as it now trades at $0.5287.
