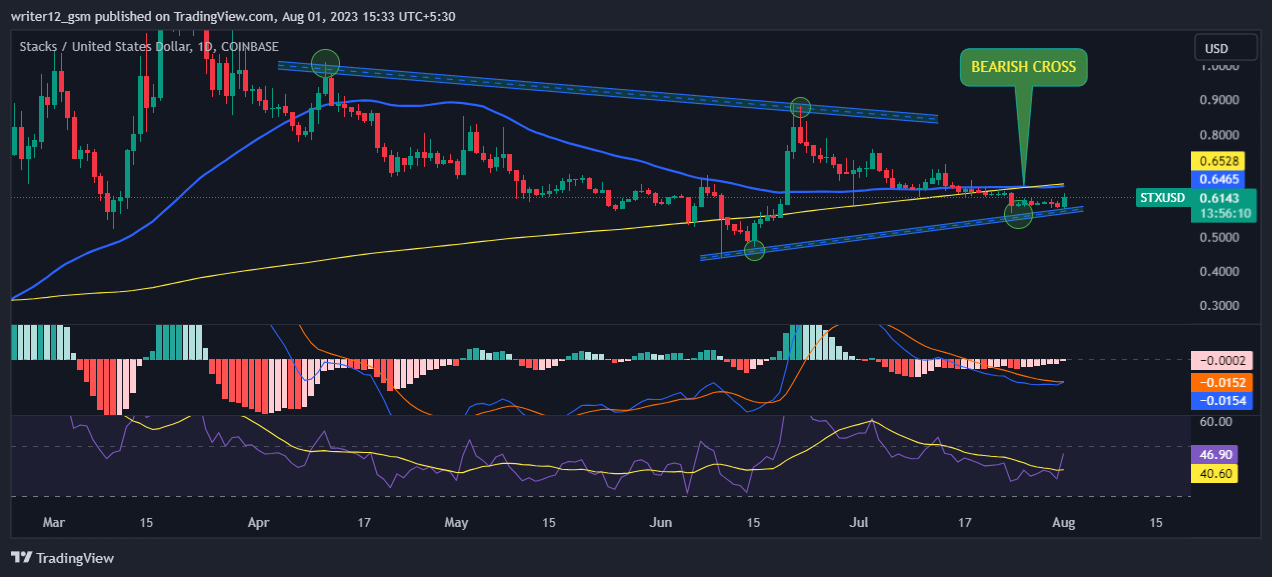
- 1 The price of Stacks (STX) is trading at the price of $0.6123. However, the crypto’s price rose by 4.29% in the last 24 hours (press time).
- 2 STX price observed an increase of 3.50% in the last 7 days.
- 3 The market capitalization of Stacks is $855.525 Million.
Stack is a cryptocurrency that allows smart contracts and decentralized applications to run on the Bitcoin network. STX is used to fuel the smart contracts, to reward miners who maintain the network, and to enable holders to earn bitcoin by locking their STX in a process called Stacking.
STX is based on a unique consensus mechanism called Proof of Transfer, which uses the security and finality of Bitcoin. STX has a maximum supply of 1.818 Billion coins and a circulating supply of 1.396 Billion coins.
As of press time, STX is trading at $0.6123, which is a 2.66% increase from the previous day. STX has also gained 0.35% in the past week, reaching a market capitalization of $855.525 Million. The fully diluted market cap of STX is $1.115 Billion, and the 24-hour trading volume is $61.245 Million. STX has delivered a 115.08% return in the last six months, and a 194.38% return since the start of the year.
Stacks Price Technical Analysis

Stacks’s price is showing a downward trend, as it is trading lower than the 50-day and 200-day moving averages, which are indicators of a bearish phase. The MACD line is under the signal line and close to the zero line, which means that the bearish momentum is weak. The RSI value is under 50 and the 14 SMA line of RSI is over 50, which means that the market is bearish. The super trend has changed to red, which is a sell signal. The stochastic RSI has the K line over the D line and both are near the middle level, which means that the momentum is neutral or slightly bullish..
Technical Levels:
- Support Level – The current support level is $0.5687.
- Resistance Level –The current resistance level is $0.8873.
Conclusion
Based on the latest data and analysis, the bears and bulls are in a tight battle. Stacks is attempting to break out of a downward pattern that has two obstacles: a trendline and SMAs. The price is in a bearish phase, as it is below the 50-day and 200-day moving averages. The MACD line is below the signal line and close to the zero line, indicating a weak bearish momentum. The RSI value is below 50 and the 14 SMA line of RSI is above 50, indicating a bearish market. The super trend has turned red, indicating a sell signal. The stochastic RSI has the K line above the D line and both are near the middle level, indicating a neutral or slightly bullish momentum.
Disclaimer
The analysis given in this article is for informational and educational use only. Do not use this information as financial, investment, or as trading advice. Investing and trading in crypto is a risky task. Please consider your circumstances and risk profile before making any investment decisions.
 thecoinrepublic.com