- 1 Fantom price prediction indicates the declining momentum of FTM crypto.
- 2 FTM crypto has slipped below the 20, 50, 100 and 200-days Daily Moving Average.
- 3 The pair of FTM/BTC was at 0.000008397 BTC with an intraday gain of 0.42%.
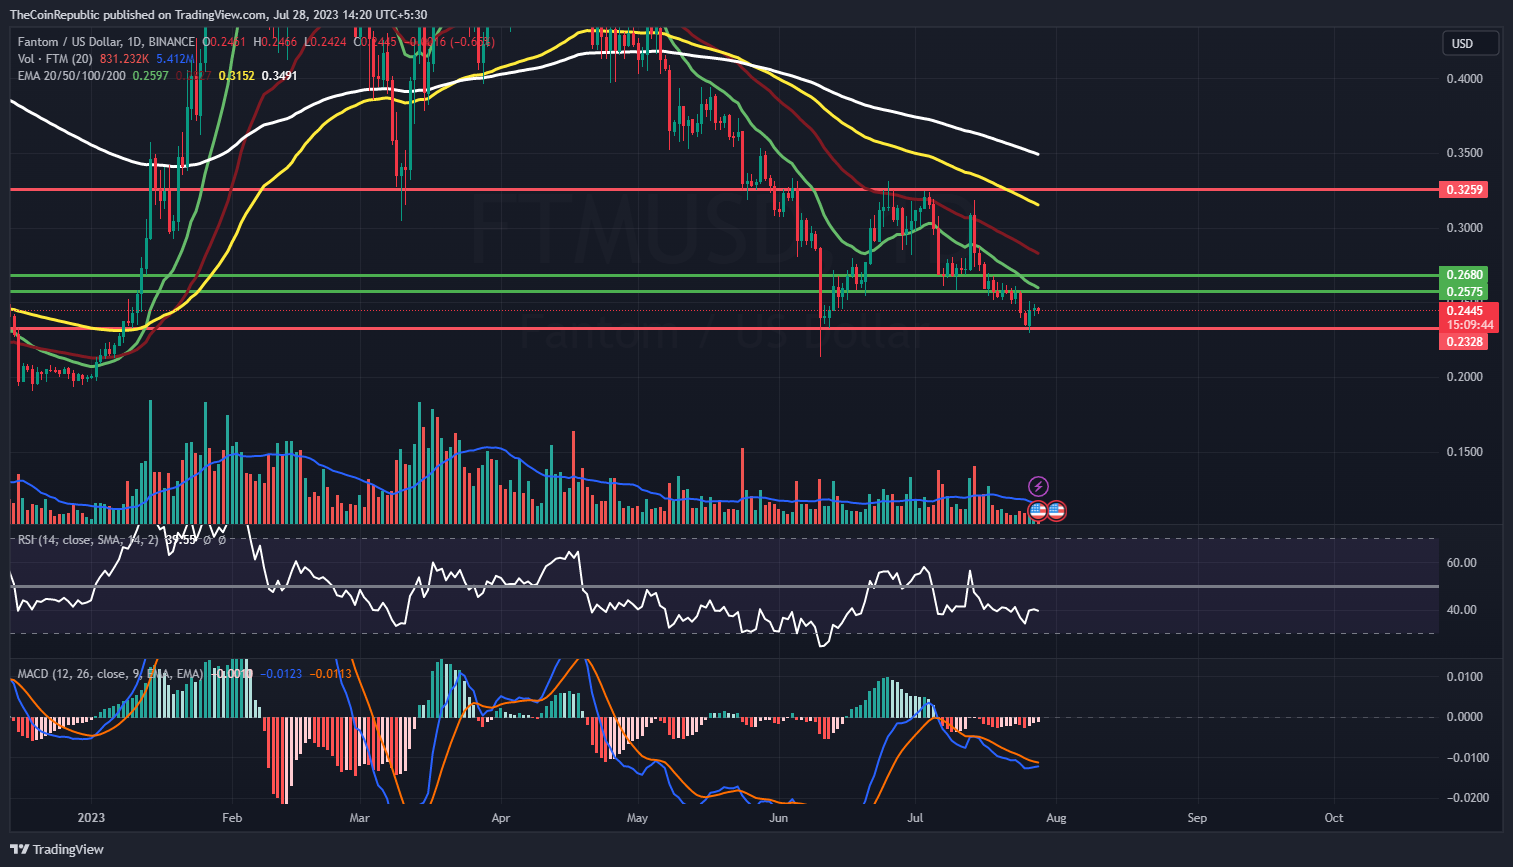
Fantom price prediction showcases the sustainability issues of FTM crypto as it is trying to get up from the lower level. Fantom prices need to increase the accumulation rate of buyers in order to surge towards the upper level. FTM crypto has been declining from the $0.3260 level and declined till the $0.2321 lowest level. Investors in FTM cryptocurrency need to wait until the FTM crypto price breaks out of the primary resistance level of $0.2575.
Fantom price was at $0.2445 and has lost 0.65% of its market capitalization during the day’s trading session. Trading volume has decreased by 28% during the intraday trading session. This demonstrates that sellers are trying to pull the FTM crypto downwards over the charts. Volume to market cap ratio was at 0.0621.
Fantom Price Prediction: Technical Indicators are Divergent

Fantom price prediction suggests the bearish trap over the FTM crypto which has led the cryptocurrency to slump. FTM crypto needs to attract buyers in order to surge towards the upper recovery level over the daily time frame chart. However, trading volume can be seen below average and needs to grow in favor of buyers. Meanwhile, FTM crypto has slipped below the 20, 50, 100 and 200-days Daily Moving Average.
Fantom price has decreased around 5.62% in a week and 22.29% in a month. Moreover, FTM crypto lost 42.36% in the last three months and 45.72% in the last six months. Nevertheless, Fantom price has gained 21.88% year-to-date. This confirms the facts regarding FTM crypto’s recovery phase in 2023.
Technical indicators are pretty divergent over the price action of Fantom price. Relative strength index showcases the downside trend of FTM crypto. RSI was at 39 and is heading towards the oversold territory.
MACD, on the other hand, exhibits the sustainability of Fantom crypto price. The MACD line is moving towards the signal line for a positive crossover. Investors in Fantom cryptocurrency need to wait for any directional change over the daily time frame chart.
Summary
Fantom price forecast highlights the sustainability concerns of FTM crypto as it attempts to recover from its low position. FTM coin has been dropping from $0.3260 and has now reached a low of $0.2321. However, trading volume is below normal and should increase in the favor of buyers. Fantom price has dropped by about 5.62% in a week and 22.29% in a month. Nonetheless, the Fantom price has increased by 21.88% year-to-date. The price movement of Fantom is causing technical indicators to diverge significantly. Investors in Fantom coin should watch the daily time frame chart for any directional changes.
Technical Levels
Support Levels: $0.2408 and $0.2328
Resistance Levels: $0.2575 and $0.30
Disclaimer
The views and opinions stated by the author, or any people named in this article, are for informational purposes only, and they do not establish financial, investment, or other advice. Investing in or trading crypto or stock comes with a risk of financial loss.
 thecoinrepublic.com