After achieving a new yearly high on June 30, the Bitcoin Cash (BCH) price has experienced a decline. Nonetheless, there are indications that the correction phase might be over.
BCH’s price has demonstrated an impressive surge of 170%, with only minor pullbacks so far. Recent short-term readings also suggest that the correction may have ended.
BCH Price Falls Slightly After Long-Term Resistance Rejection
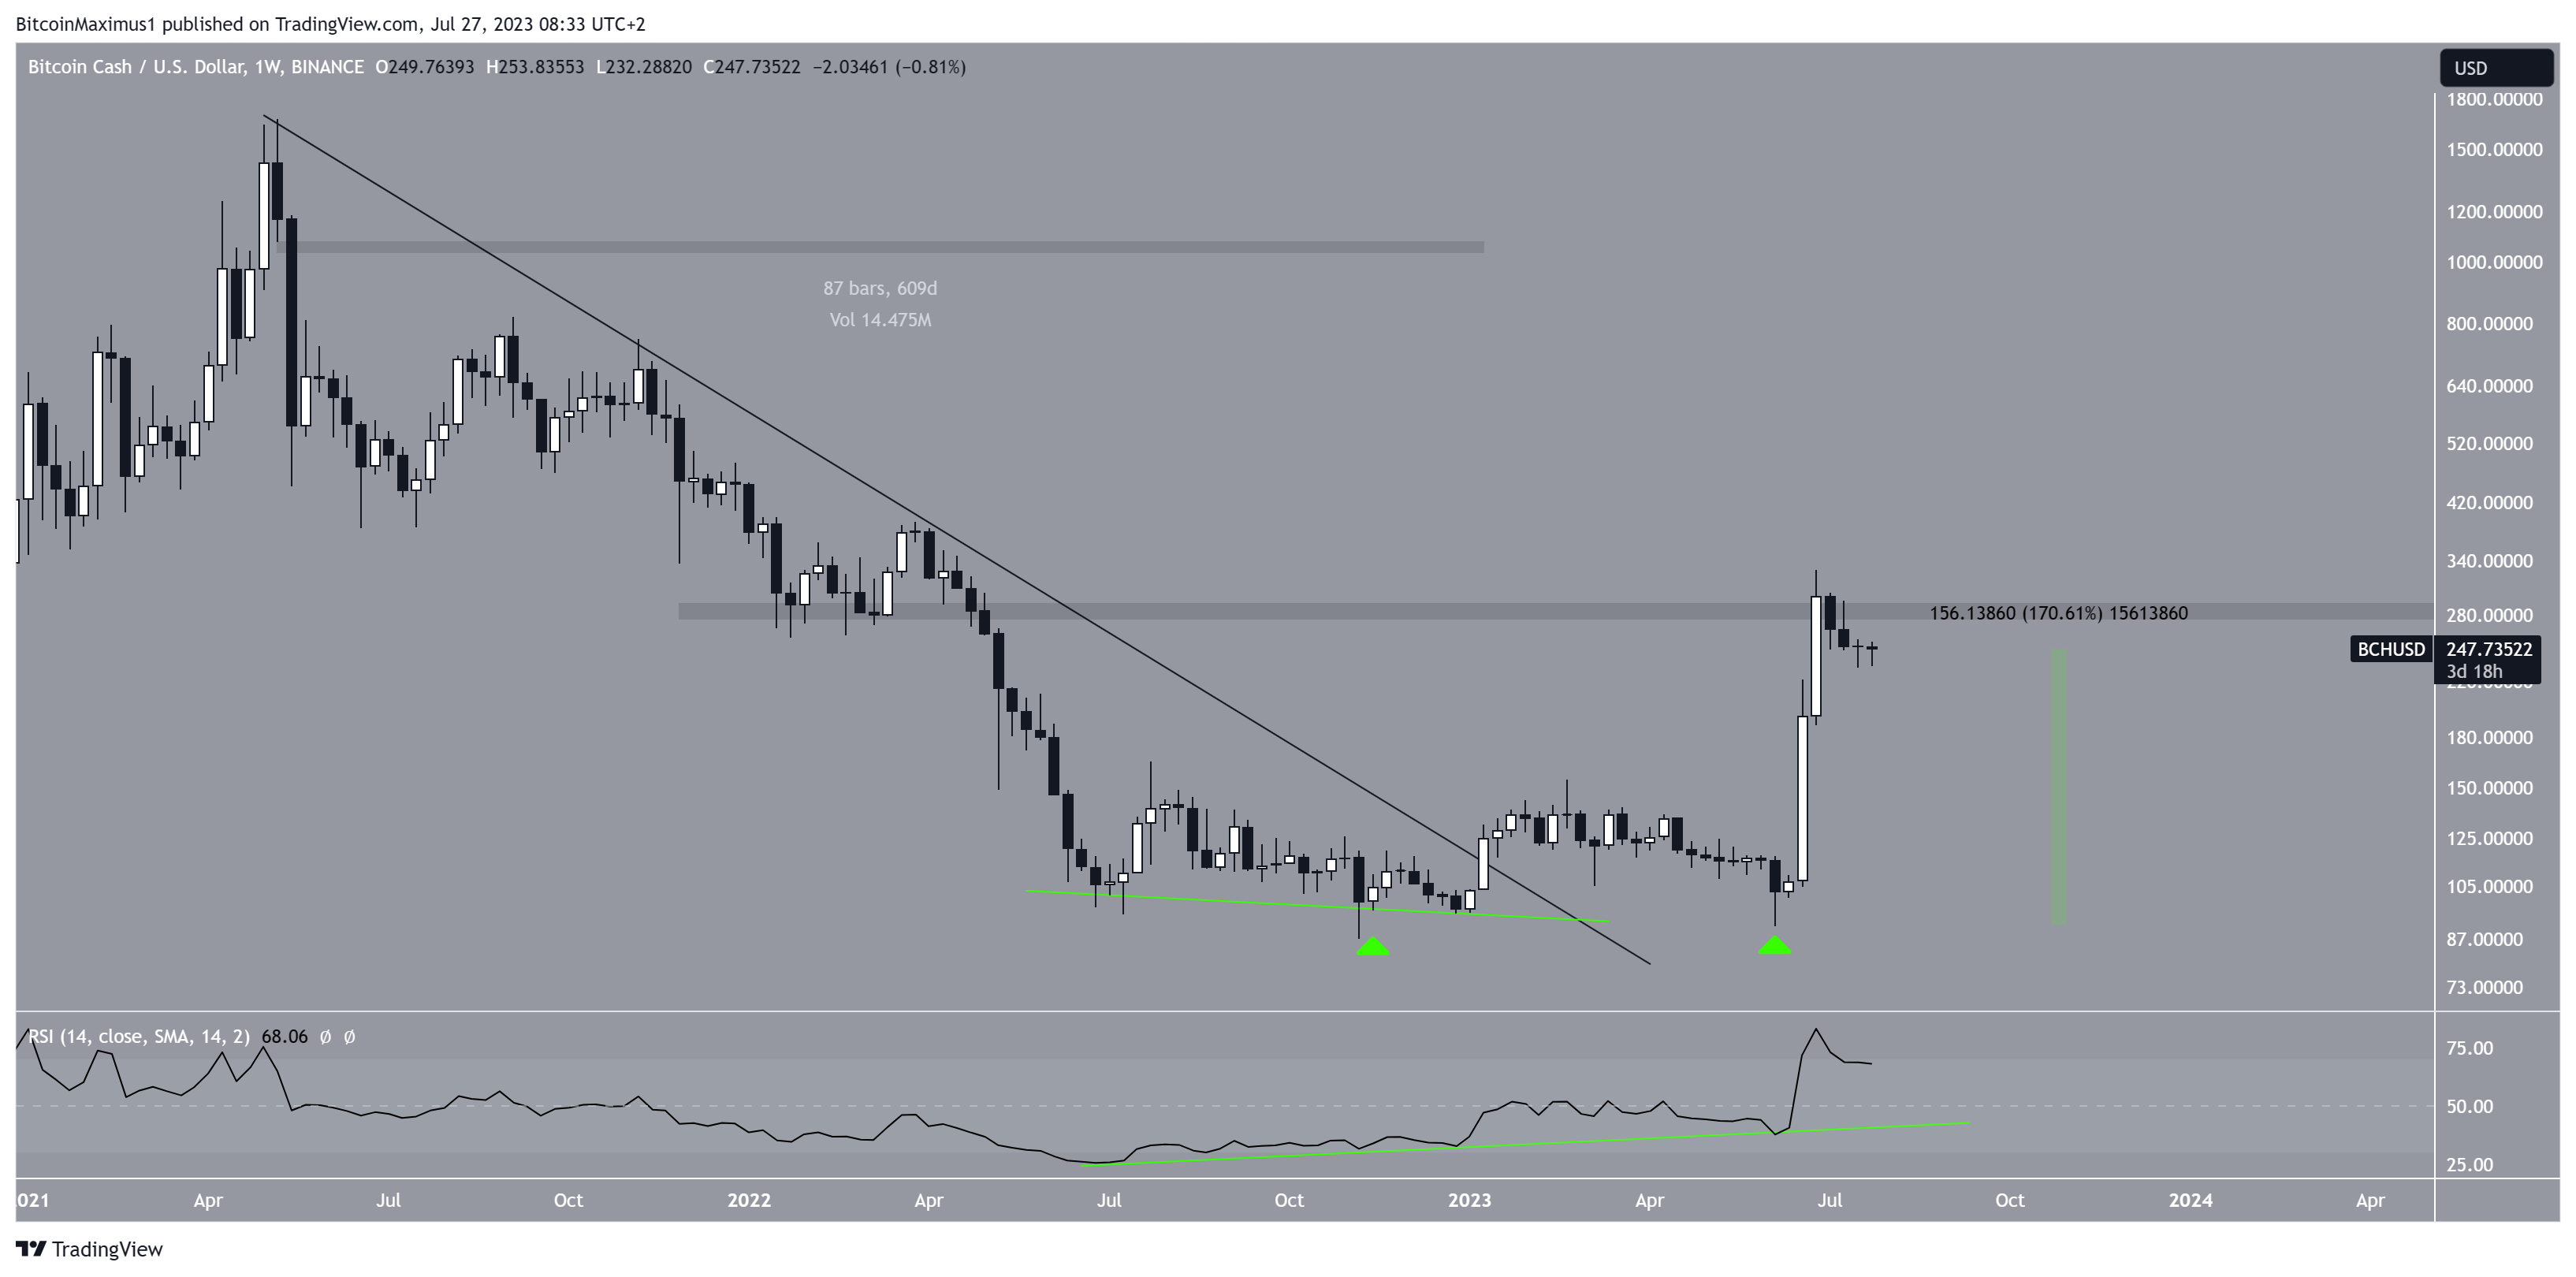
The technical analysis of the weekly chart reveals that BCH’s price has been following a downward resistance line since May 2021. During this period, BCH’s lowest point was $86, slightly above its all-time low of $81 recorded in December 2018.
However, there has been a noteworthy growth in BCH price since then. In January 2023, it finally broke from the descending resistance line that had constrained it for 609 days.
Although there was a brief retracement to its pre-breakout levels in June, BCH experienced a strong rebound after forming a double bottom pattern (green icons). The double pattern is considered bullish, often leading to significant upward movements. Consequently, the price of BCH has surged by approximately 170% since the formation of the double bottom.
BCH is trading just below the $285 mark, and how the market responds to this level will be critical in determining its future trend. The rejection and decrease from the area coincided with miners withdrawing $263 billion.

The ongoing price increase is further supported by the weekly RSI, a momentum indicator used by traders to assess market conditions and make buying or selling decisions.
When the RSI reading is above 50 and trending upwards, it indicates that the bulls have an advantage, signaling a potential bullish trend. In the current situation, the RSI is above 50 and steadily increasing, both of which are positive indicators of a bullish trend.
Moreover, a bullish divergence (green line) preceded the entire upward movement. This is an additional encouraging sign commonly associated with bullish trend reversals, adding credibility to the ongoing price increase.
BCH Price Prediction: Is the Correction Complete?
Analyzing the daily time frame, the outlook for BCH appears positive due to the wave count analysis.
In the long term, the wave count indicates a robust bullish trend. Analysts who utilize the Elliott Wave theory study historical price patterns and investor psychology to determine the likely direction of the trend.
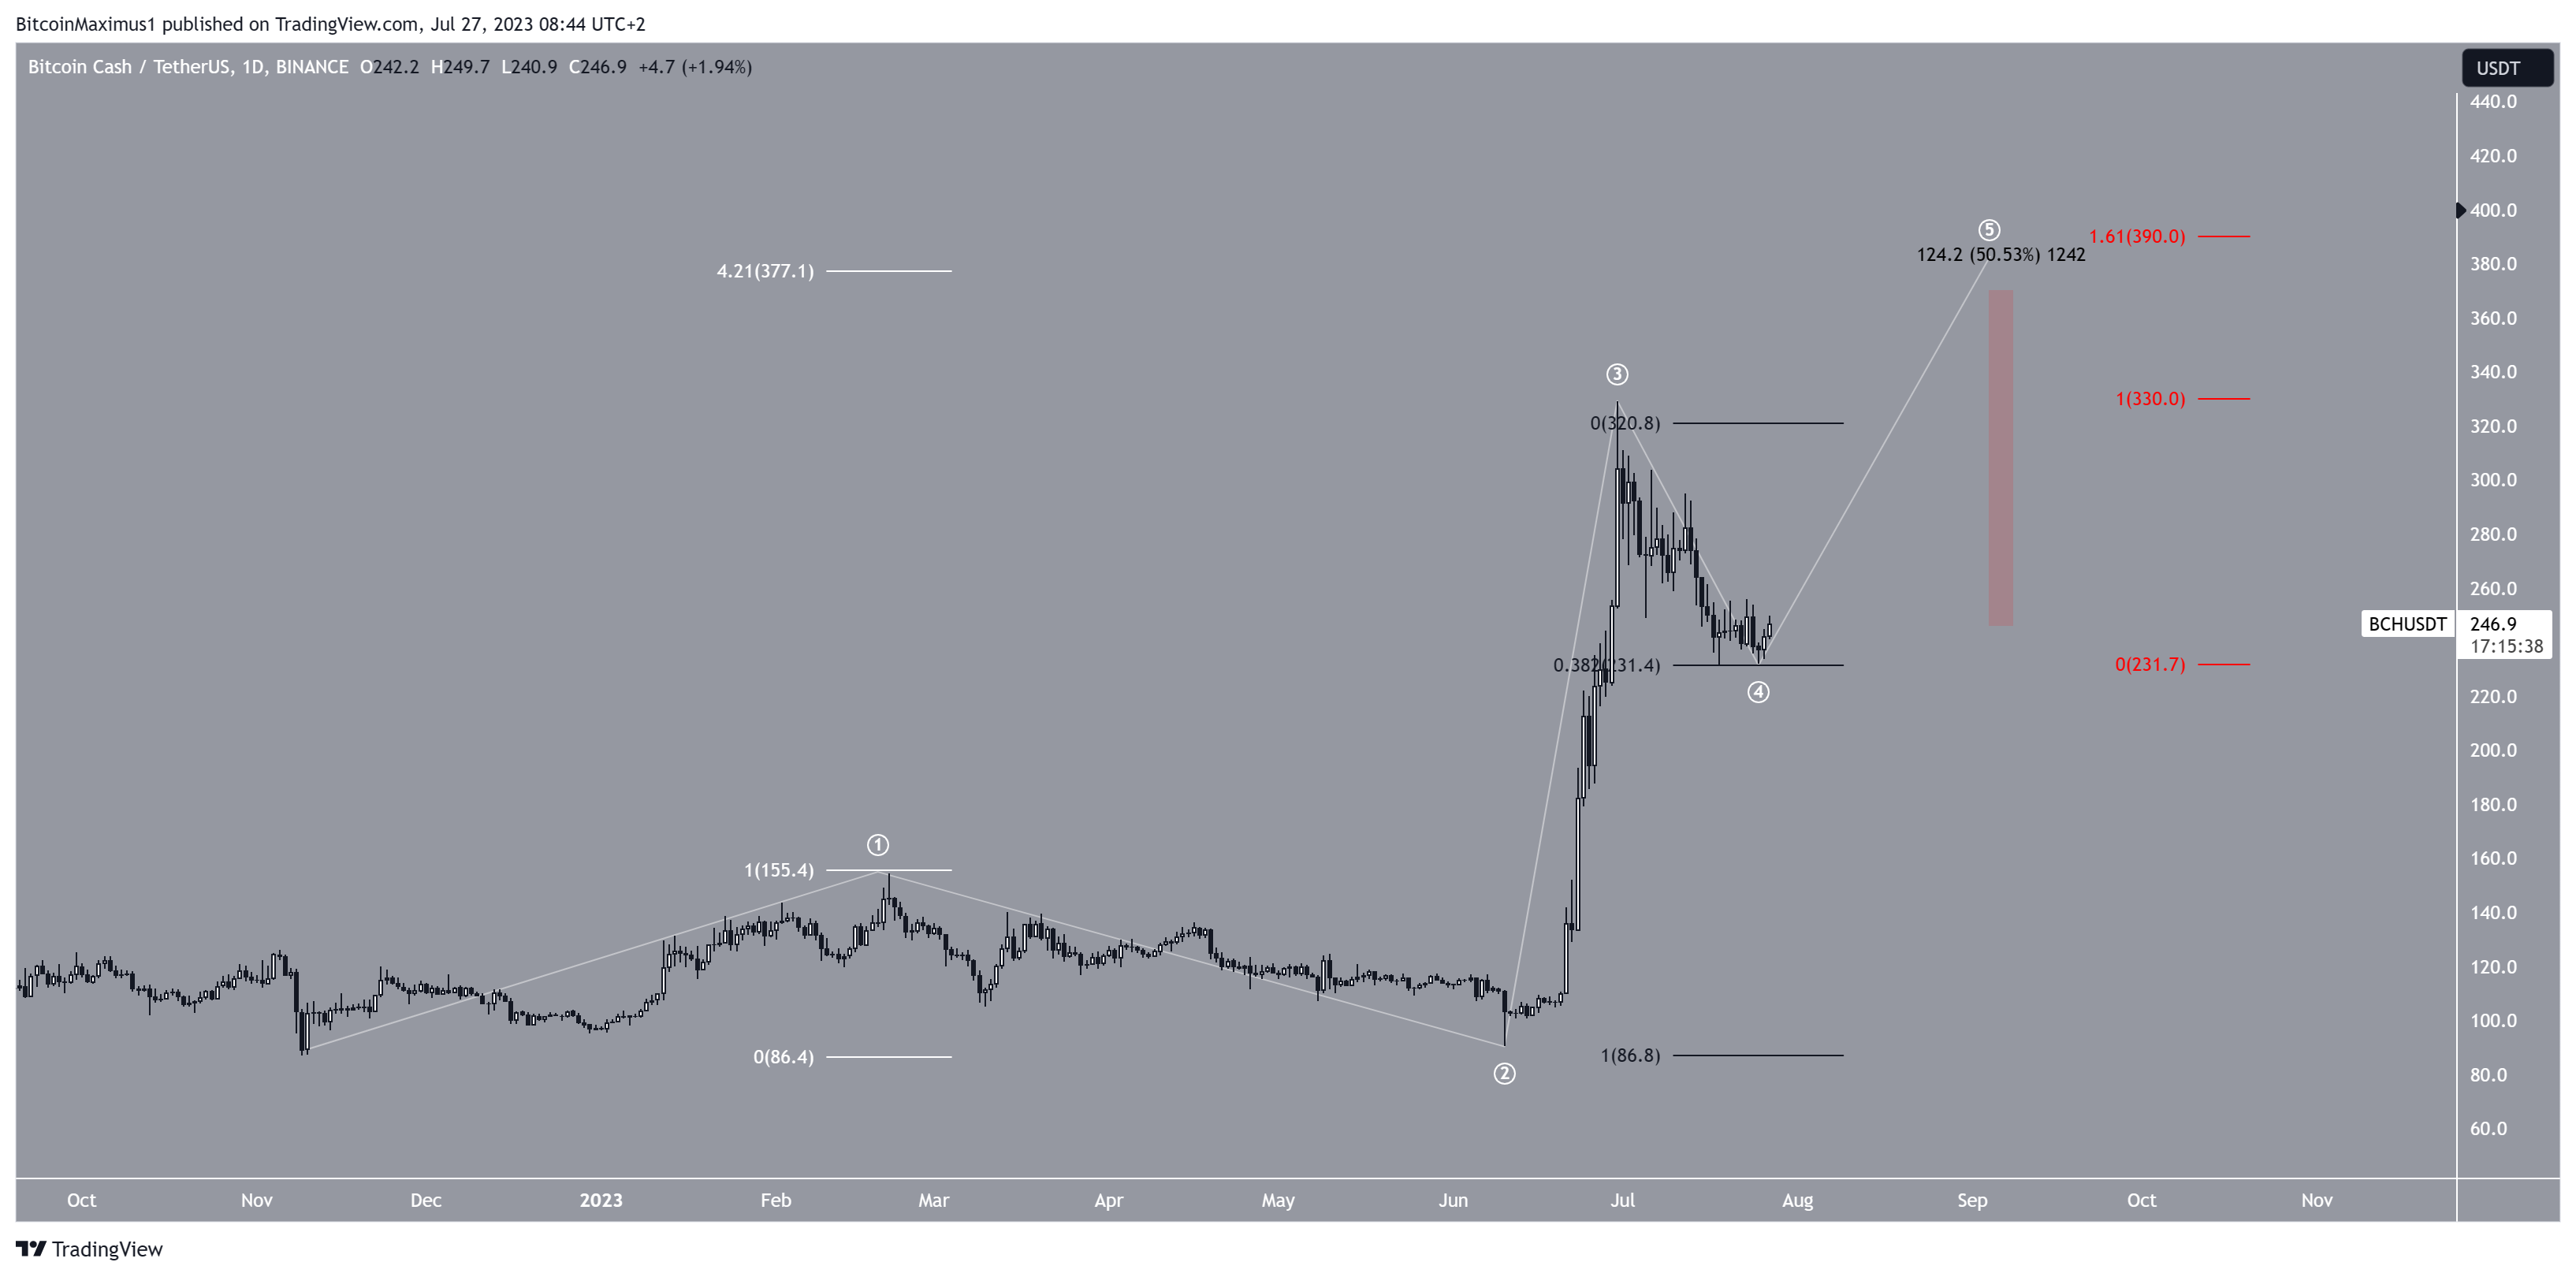
Given the significant surge, the wave count suggests that the current BCH price has initiated a five-wave upward movement (white). Among these waves, the third wave has experienced an extension. This is the most common extension in a five-wave increase.
On July 18, the price rebounded from the 0.382 Fibonacci retracement support level (black). The principle behind Fibonacci retracement levels suggests that after a substantial price movement in one direction, the price will partially retrace to a previous level before continuing its original direction. The 0.382 level is commonly where wave four concludes.
If the wave count is accurate, the BCH price is anticipated to complete wave five within the $380-$390 range, an area derived from the 4.21 extension of wave one (white) and the 1.61 external retracement of wave four (red). This indicates a potential target for the ongoing bullish movement in the specified price range.
Measuring the current price, the target would amount to an increase of roughly 50%.

Despite this bullish BCH price prediction, falling below $233 will mean that the BCH price is still correcting inside wave four. In that case, a drop to $200 will be expected before an eventual bounce and a new yearly high.
 beincrypto.com
