-
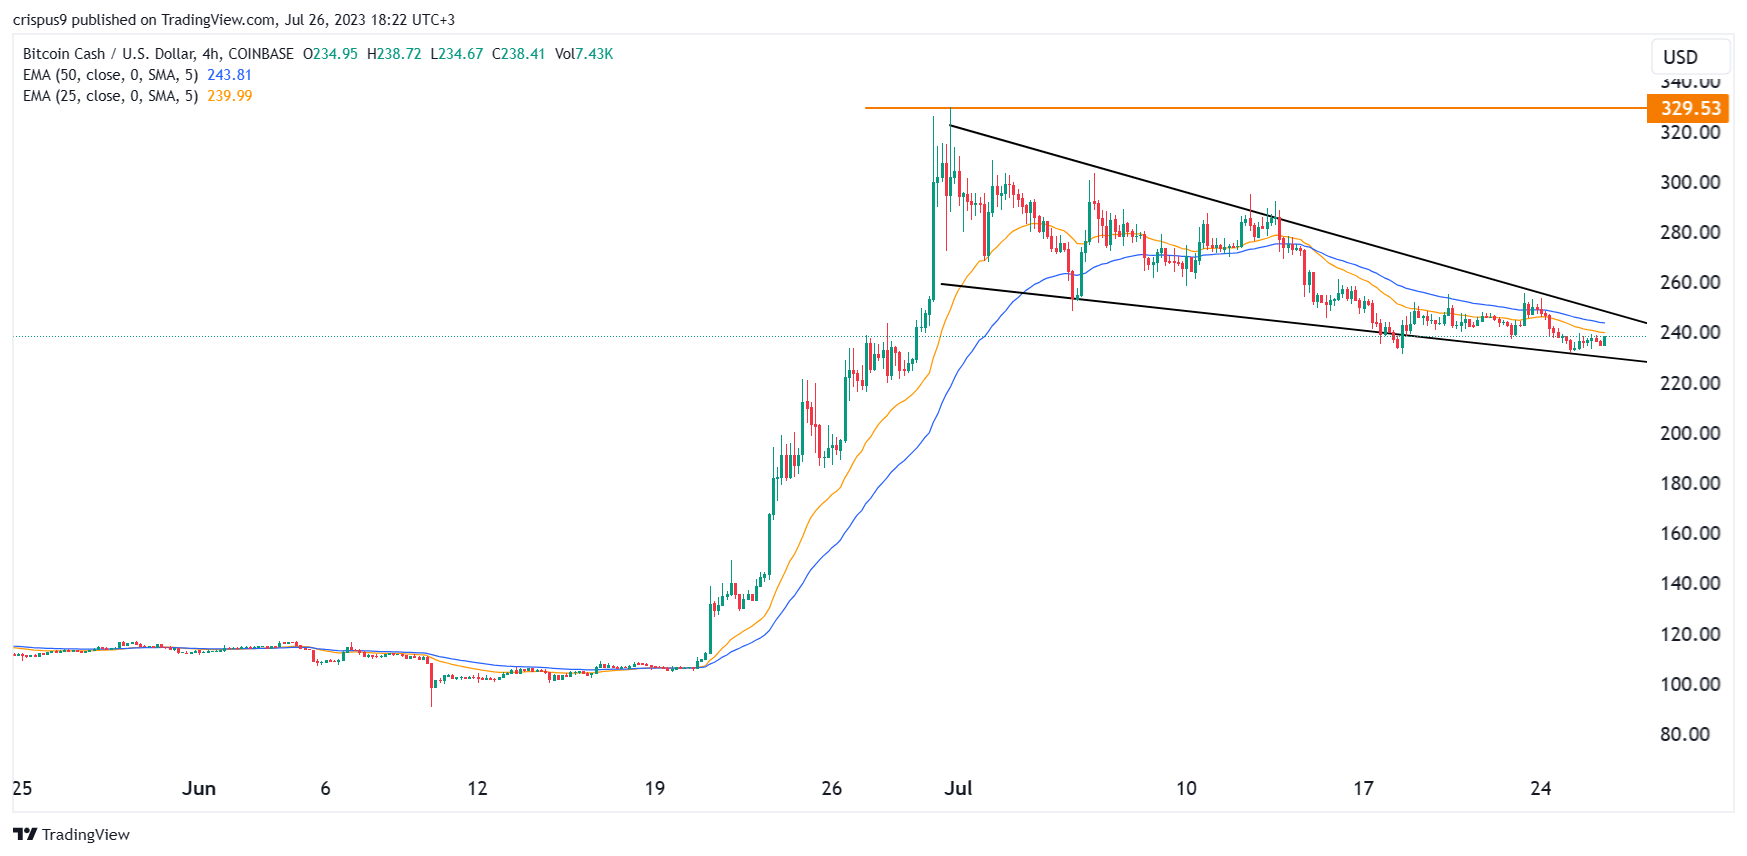
Bitcoin Cash price has formed a falling wedge pattern on the 4H chart.
-
Focus shifts to the upcoming interest rate decision by the Fed.
Bitcoin Cash price has retreated in the past few weeks as the recent momentum in the crypto industry waned. The coin dropped to a low of $240 on Wednesday, much lower than the year-to-date high of $329. This means that BCH has dropped by more than 27% from the highest point this year.
Fed interest rate decision ahead
Bitcoin Cash price has been in a strong downward trend in the past few weeks. This trend started on June 30th when the coin soared to a high of $329. It also mirrors the performance of other major cryptocurrencies like Bitcoin, Ethereum, and Litecoin.
The next likely catalyst for Bitcoin Cash and other cryptocurrencies will be the upcoming interest rate decision by the Federal Reserve. Economists believe that the bank will decide to hike interest rates by 0.25%. It will also signal that this will be the final rate hike this year since inflation is falling at a faster pace than expected.
Data published earlier this month showed that the American consumer price index (CPI) dropped from 4.1% in May to 3% in June. Inflation has been falling after peaking at 9.1% in 2021. Therefore, another bearish rate hike will be a positive thing for cryptocurrencies.
Meanwhile, data showed by Coinglass shows that open interest in the futures market has dropped by more than 1.45% in the past 24 hours. Open interest dropped to $317 million with most of it being in Binance, OKX, Bybit, Bitget, and dYdX. Binance has over $167 million while OKX has $58.9 million.
Bitcoin Cash’s open interest peaked at over $541 million after the Ripple vs SEC lawsuit. It has dropped continually to the current $317 million, as shown below.

Bitcoin Cash price prediction

The 4H chart shows that the BCH price has been in a strong bearish trend in the past few days. It has moved below the 25-period and 50-period moving averages. However, a closer look shows that the coin has formed a falling wedge pattern, which is usually a bullish sign.
Most importantly, this pattern is nearing the confluence level, signaling that a bullish breakout is possible. If this happens, the next level to watch will be at $280. A break below the support at $220 will invalidate the bullish view.