
The Bitcoin ($BTC) price and the crypto market cap (TOTALCAP) are trading below important horizontal support levels. The Compound ($COMP) price validated its previous resistance as support.
The world’s biggest asset manager BlackRock is recommending an optimal portfolio allocation of 84.9% Bitcoin. BlackRock is doubling down on its bet after filing a spot ETF application.
Crypto Market Cap (TOTALCAP) Continues Trading Below Support
The TOTALCAP experienced a decline after coming close to its highest point of the year around July 13. Initially, the price remained above the support level of $1.15 trillion. However, on July 24, it broke below this support area, indicating the possibility of a downward trend starting.
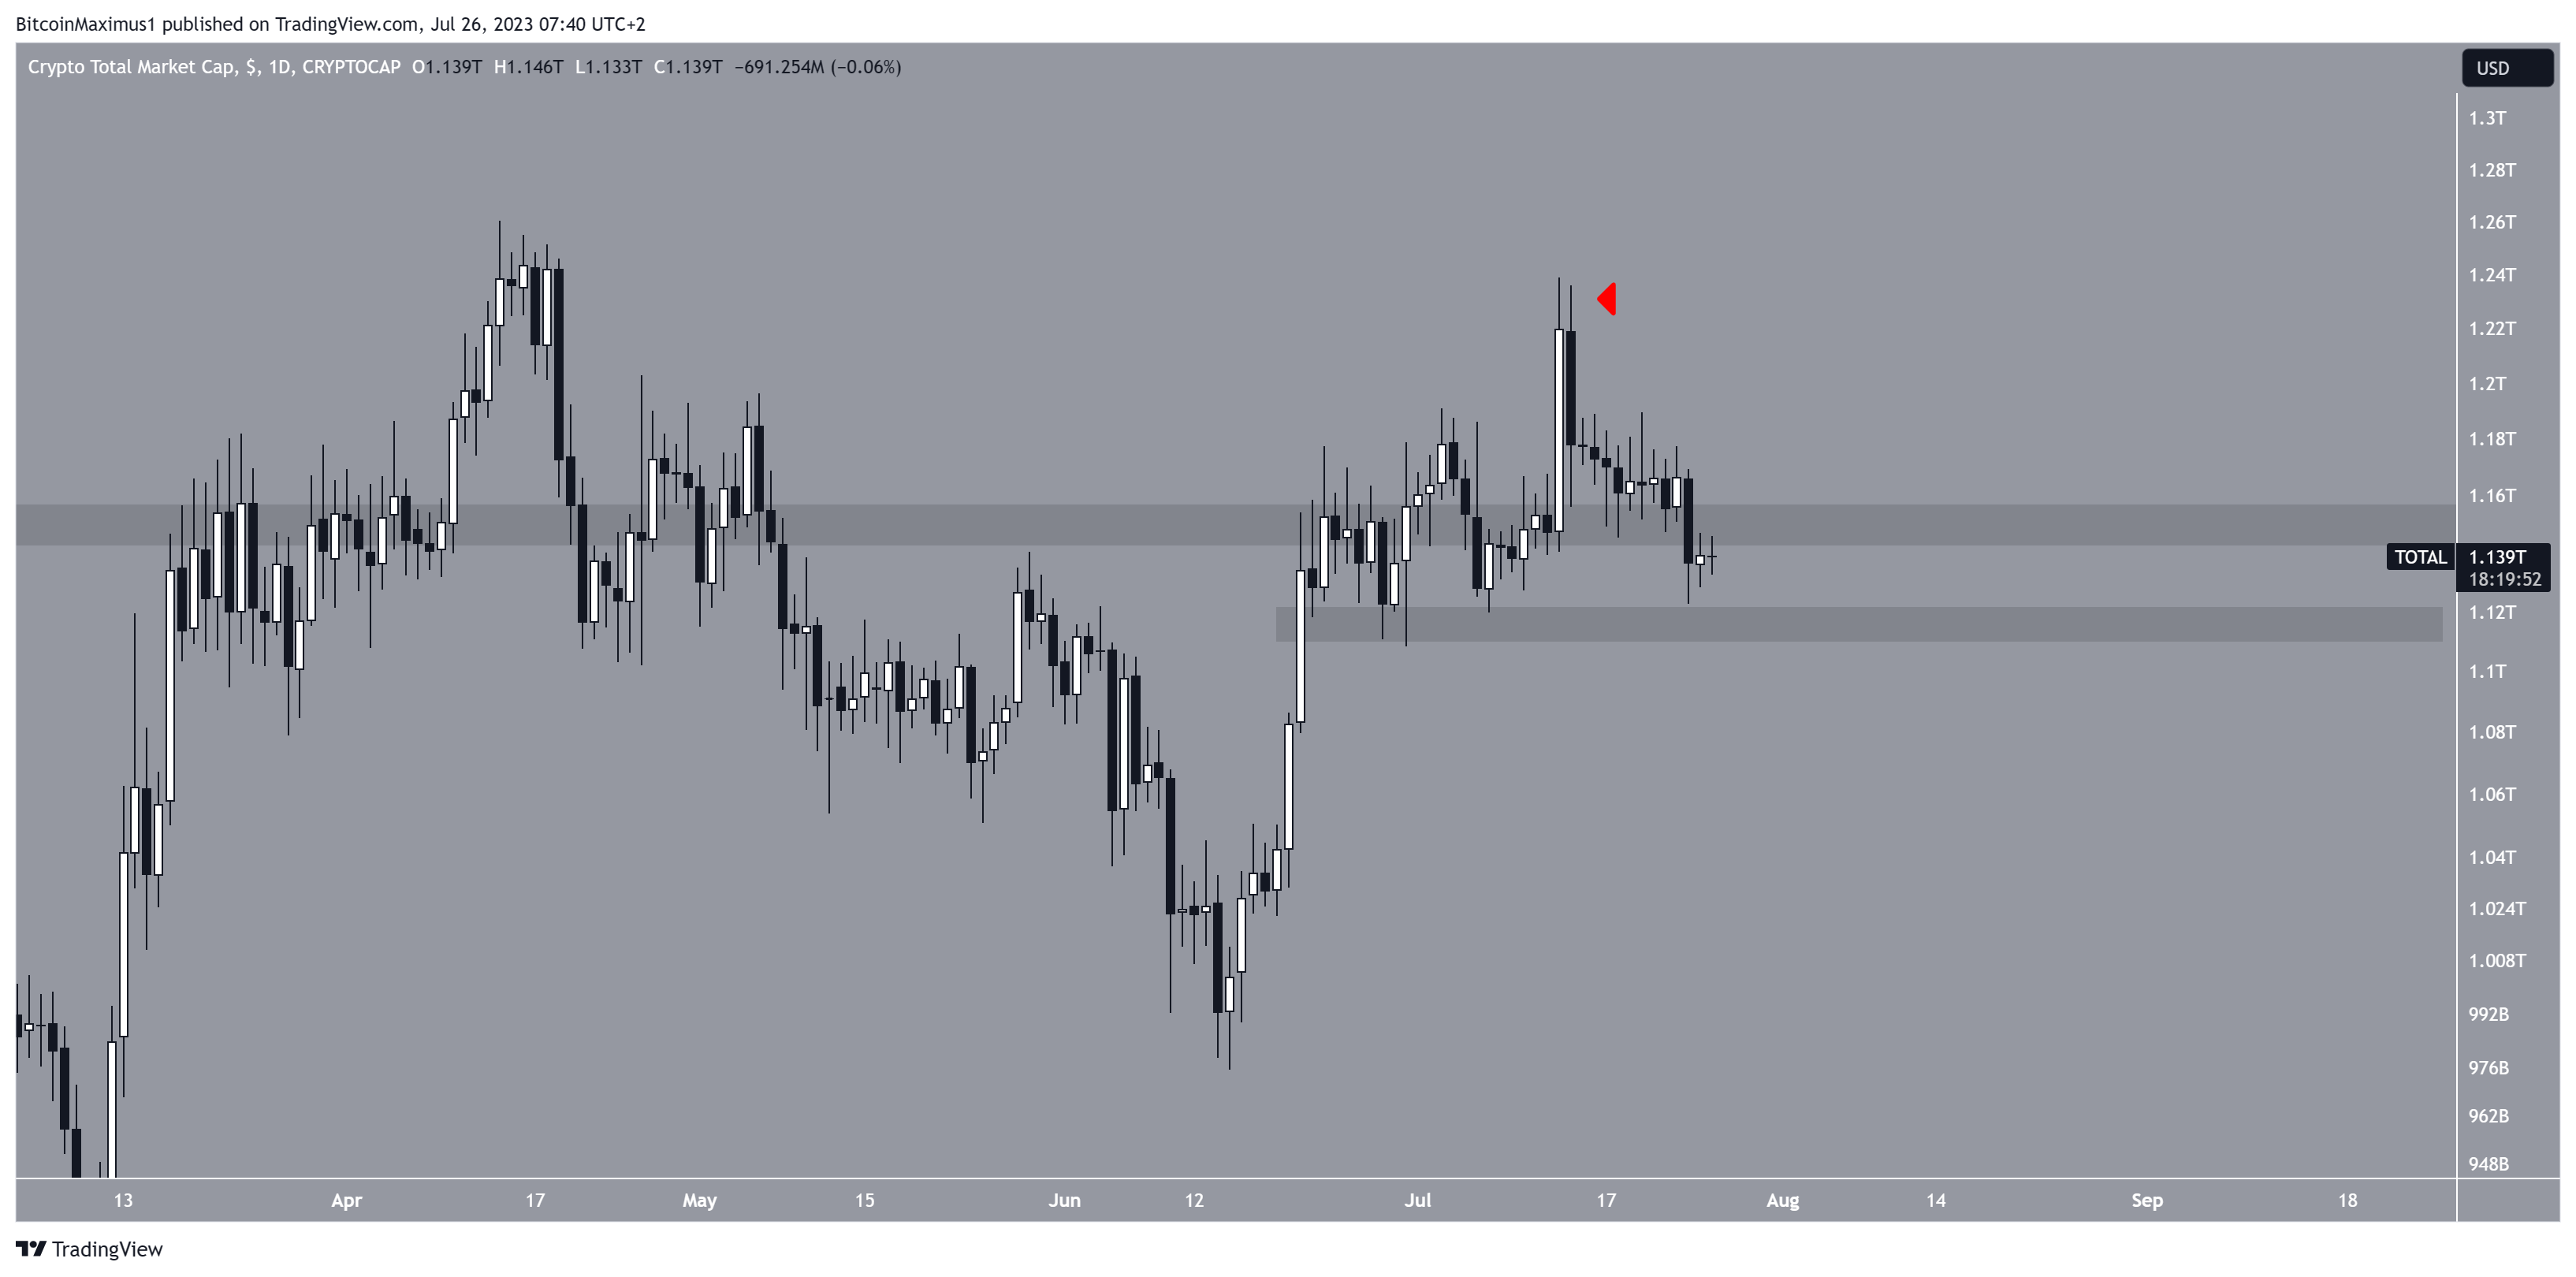
If the decrease continues, the next significant support level to watch for is $1.10 trillion. Conversely, if the price rises above the $1.15 trillion area again, it will invalidate the previous breakdown and suggest a renewed effort to reach a new yearly high.
Read More: Bitcoin ($BTC) Price Prediction
Bitcoin ($BTC) Price Hovers Inside Fib Support
Since July 13, the price of $BTC has been on a decline, catalyzed by the rejection from the resistance line of an ascending parallel channel. This decline led the price to reach the support line of the same channel.
On July 18, $BTC experienced a bounce but failed to sustain any upward momentum. Instead, on July 24, it broke down further, confirming a corrective phase in its price movement.
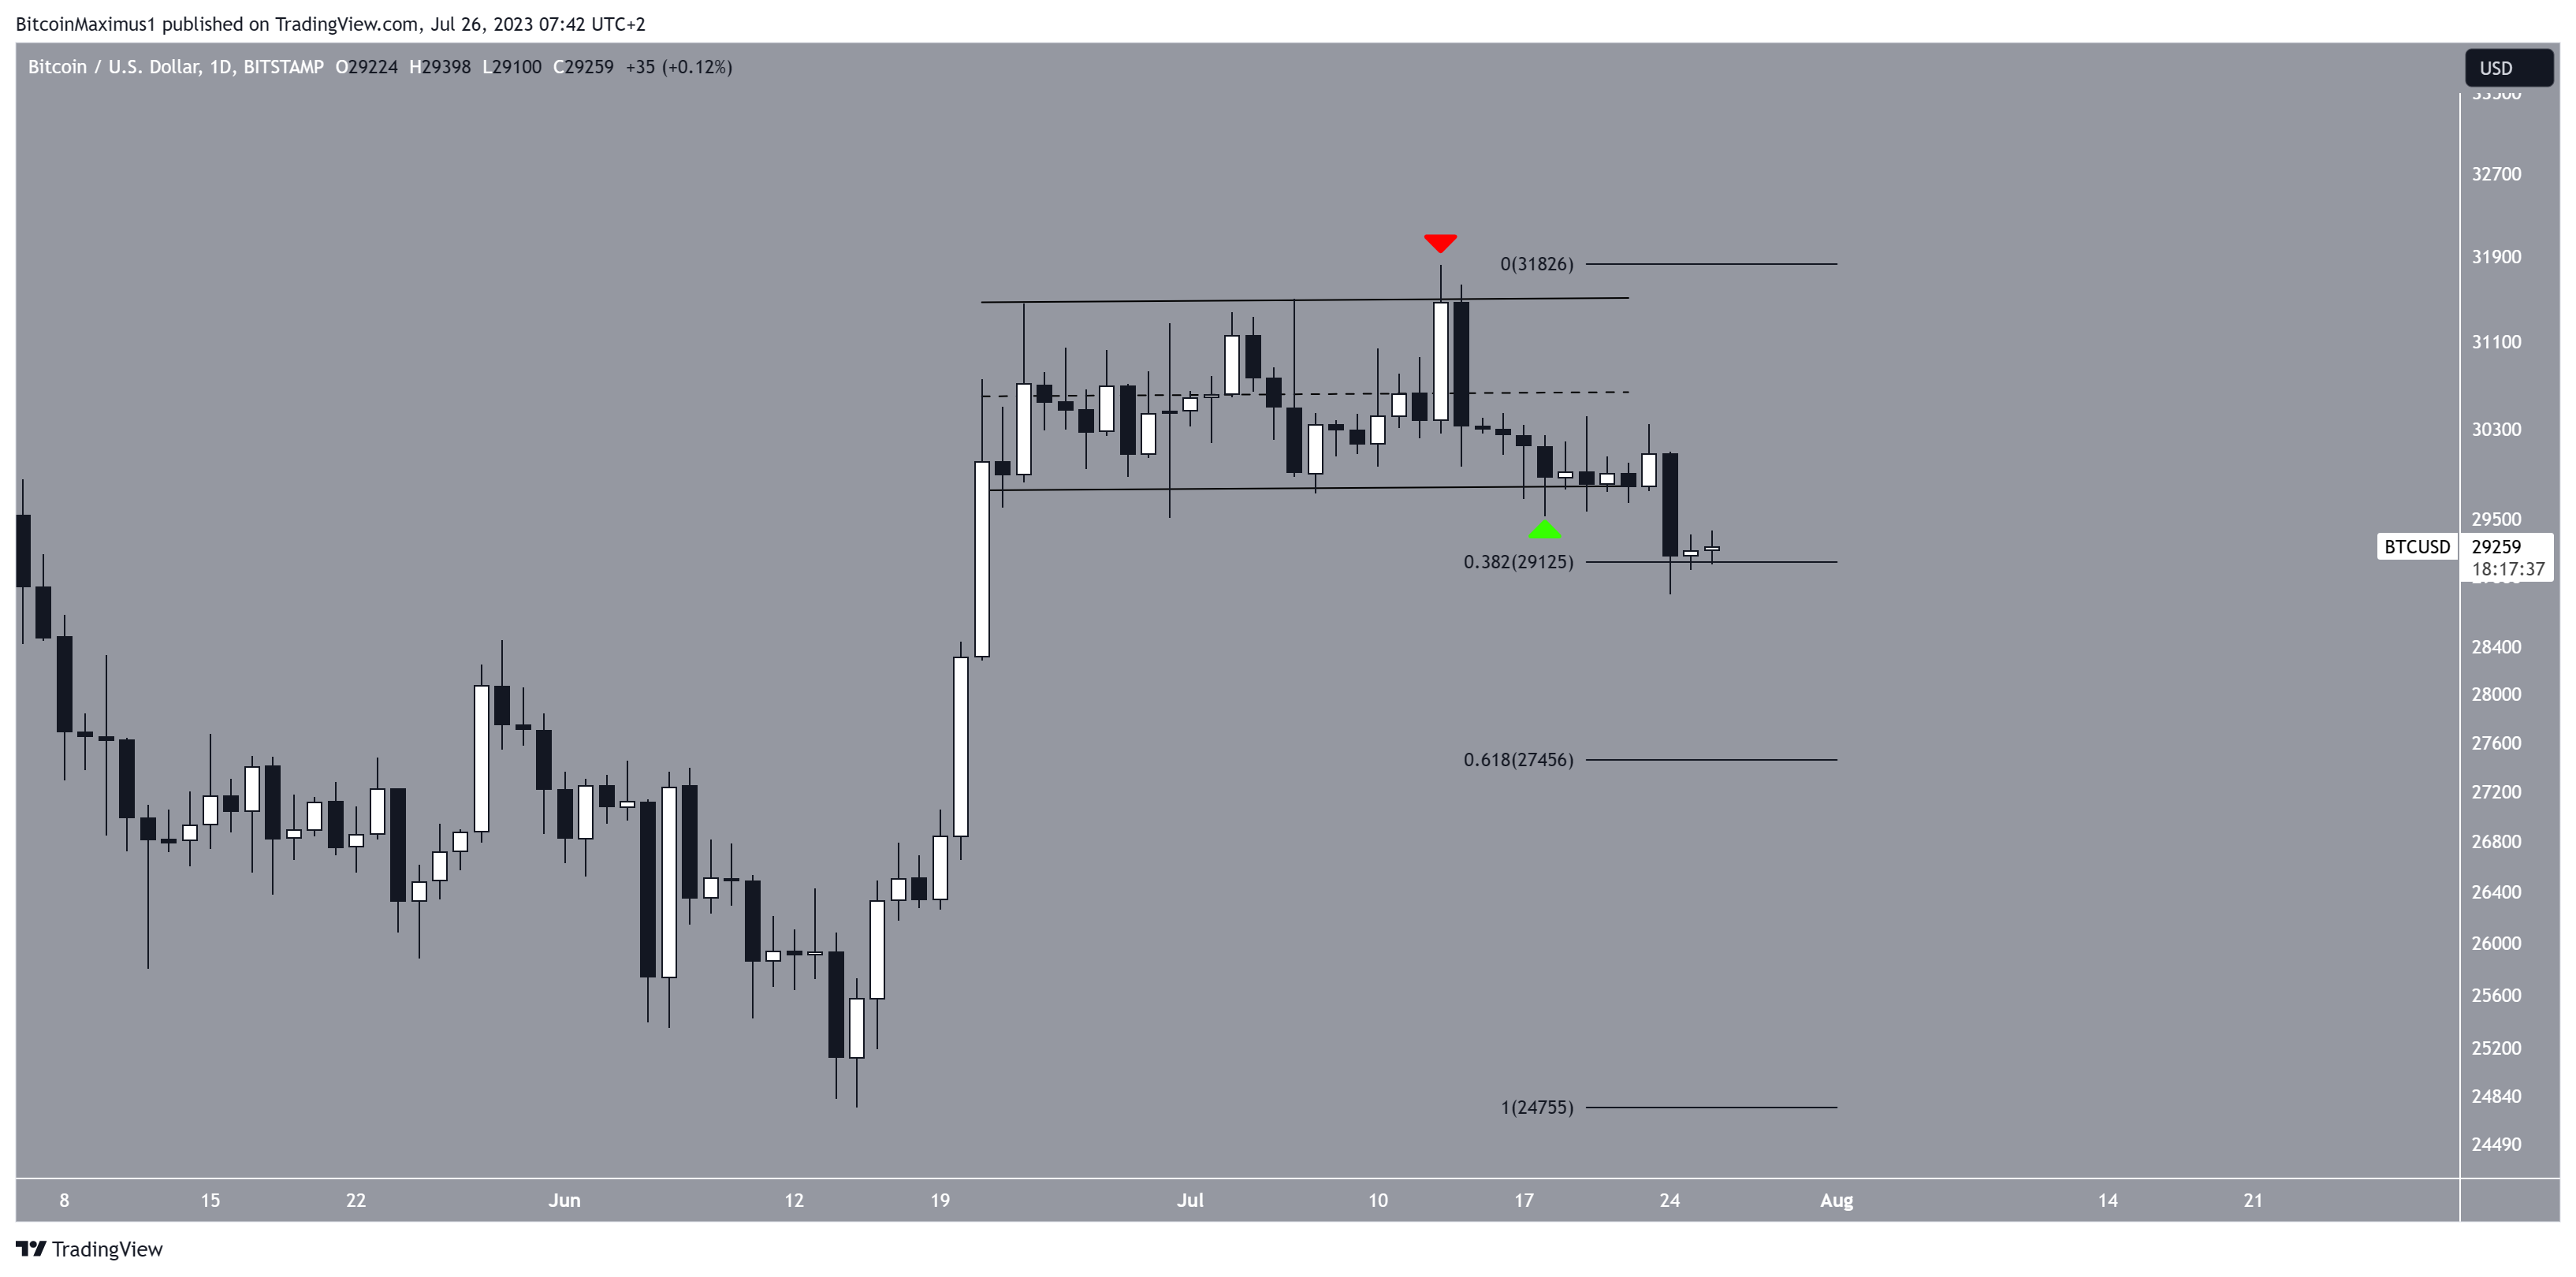
Currently, $BTC is trading above the 0.382 Fib retracement support level at $29,100. If this level fails to hold, the next support to look out for is $28,200. Conversely, a significant rebound could push the $BTC price back toward the channel’s support level at $29,700 and possibly cause a reclaim.
Compound ($COMP) Price Bounces at Crucial Support
The $COMP price broke out from a descending resistance line on June 29 and reached a new yearly high of $85.90 on July 16. The price fell afterward but bounced sharply yesterday, validating the $57 area as support and creating a long lower wick (green icon).
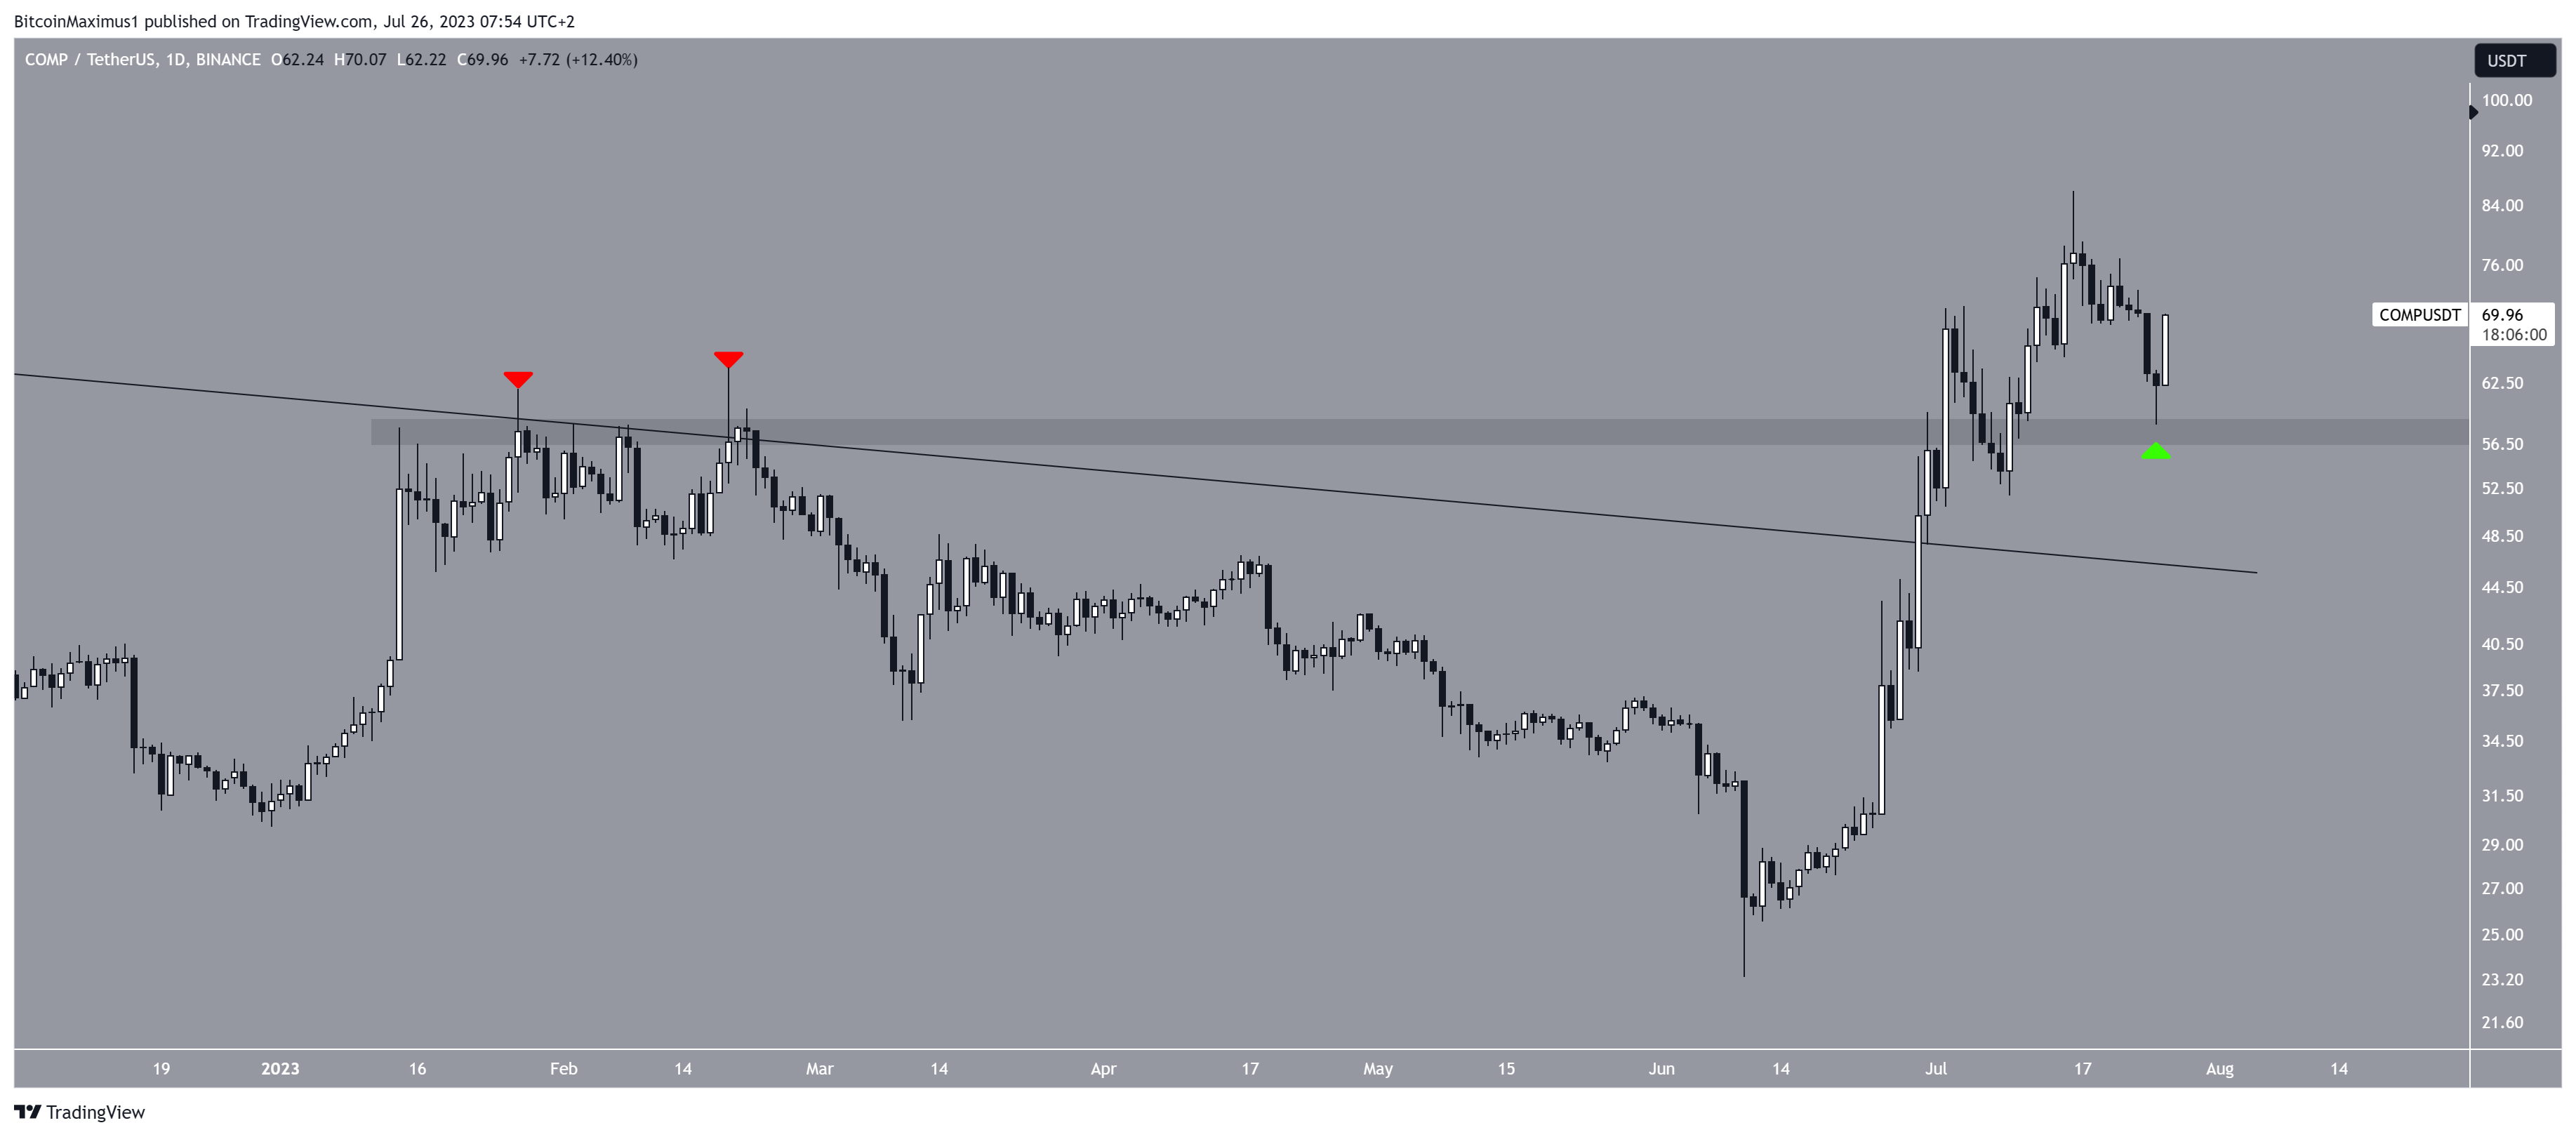
If the bounce continues, $COMP can increase to the next resistance at $100. However, if the $COMP price closes below $57, a decrease to the previous resistance line at $45 is expected.