The Algorand (ALGO) price failed to break out from a long-term resistance line and fell to a new all-time low in June.
The price has bounced since and is currently trading above an important Fib horizontal support level. The reaction to it can be crucial in determining the future trend.
ALGO Price Continues Descent Below Resistance Line
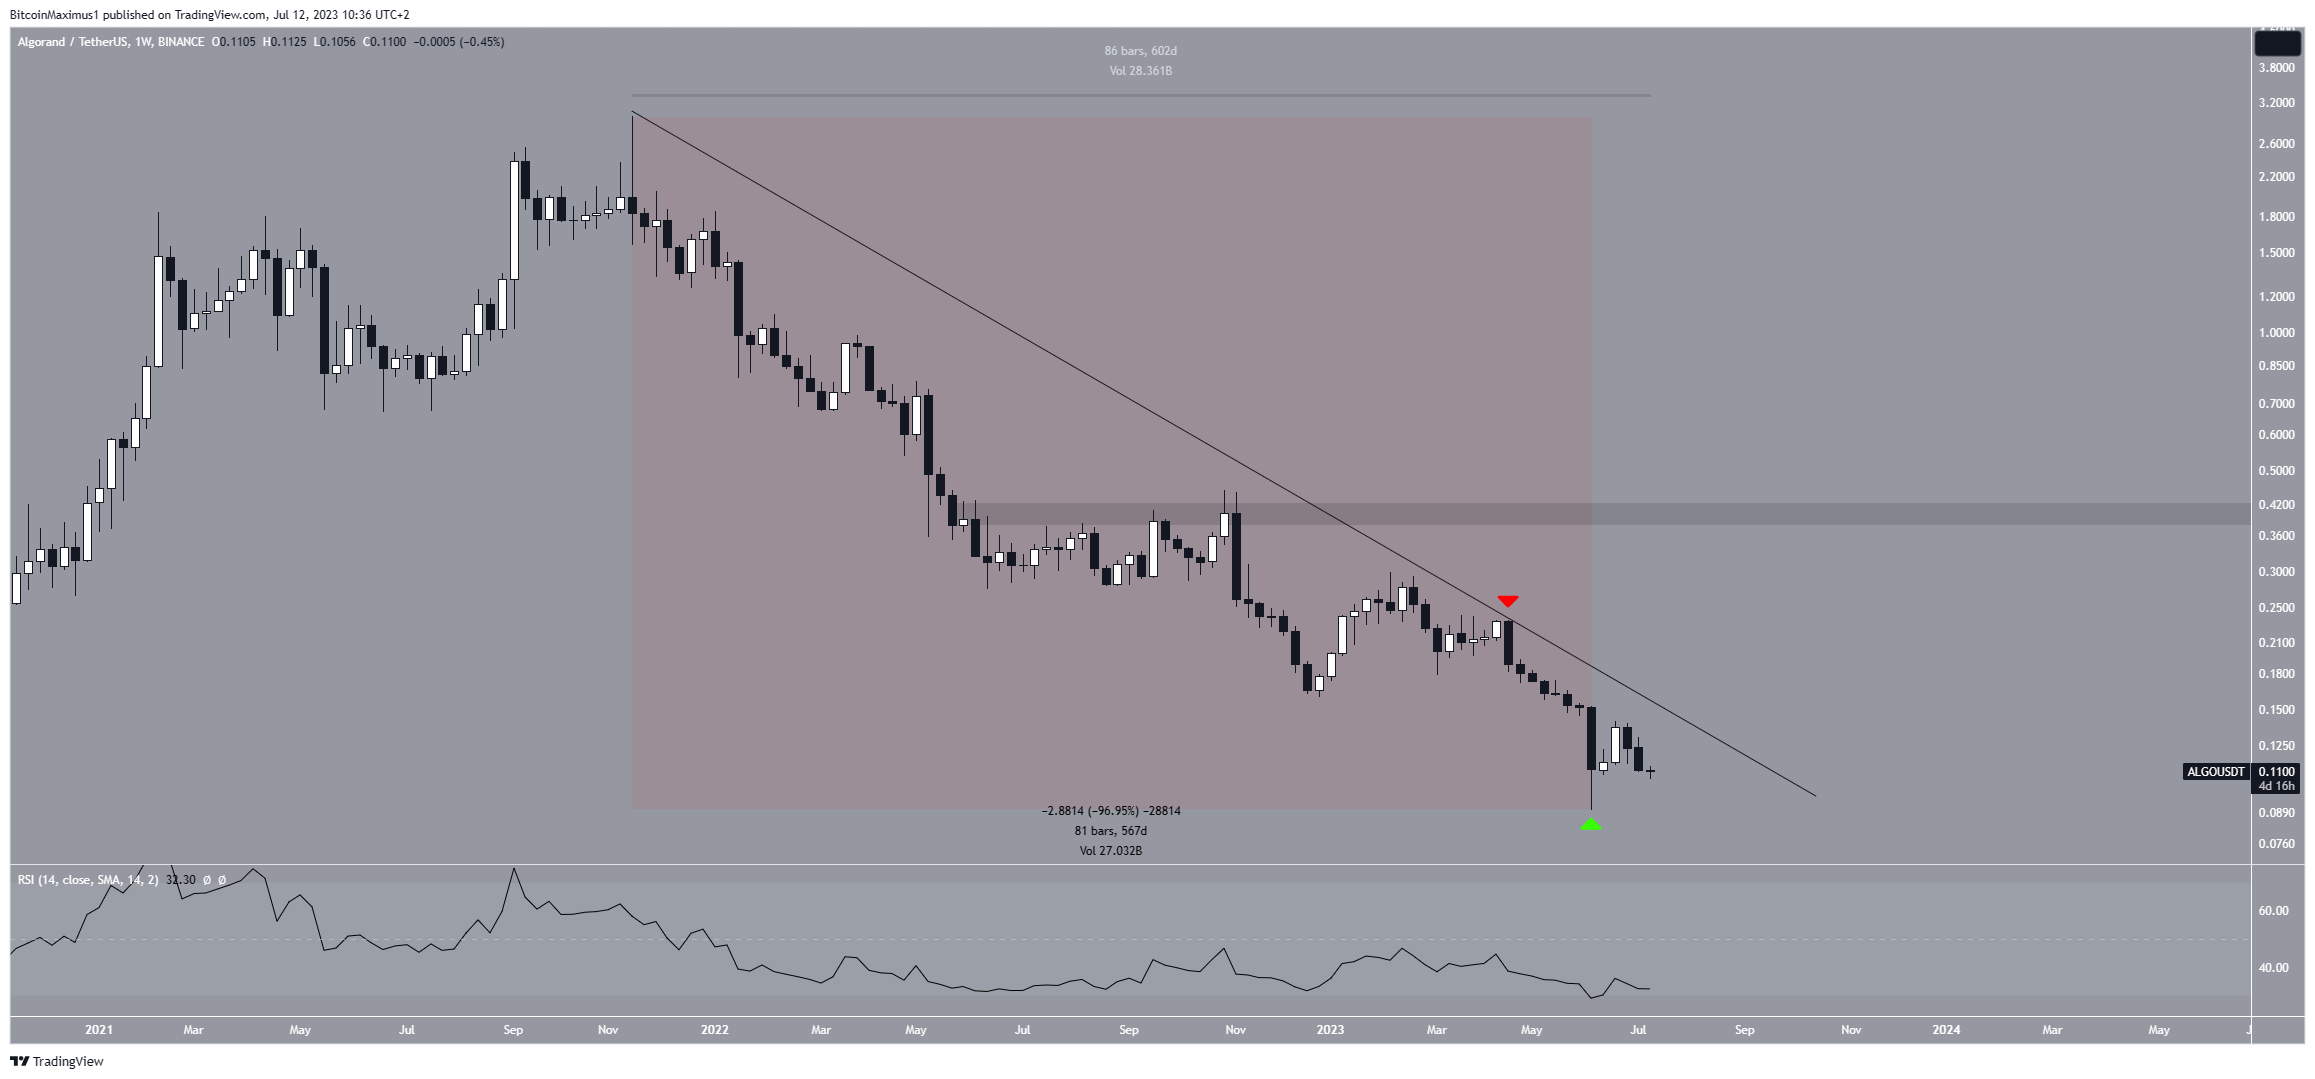
The ALGO token price has decreased below a long-term descending resistance line since September 2021. When the price trades below such a long-term structure, it indicates that the trend is bearish.
More recently, the line caused rejection in April 2023, accelerating the downward movement to a new all-time low of $0.09 in June. Measuring from the high, this was a decrease of 97%.
Read More: Best Upcoming Airdrops in 2023
The price bounced afterward, creating a long lower wick (green icon), considered a sign of buying pressure. Despite this wick, ALGO has not initiated a significant upward movement yet.
So far, the price has traded below the resistance line for 602 days.

Moreover, the weekly RSI is bearish. When evaluating market conditions, traders use the RSI as a momentum indicator to determine if a market is overbought or oversold and to decide whether to accumulate or sell an asset.
If the RSI reading is above 50 and the trend is upward, bulls still have an advantage, but if the reading is below 50, the opposite is true. The indicator is below 50 and falling, both signs of a bearish trend.
Read More: Best Crypto Sign-Up Bonuses in 2023
ALGO Price Prediction: Bounce or Break Down?
The daily time frame technical analysis does not confirm the direction of the future ALGO price trend. There are several reasons for this.
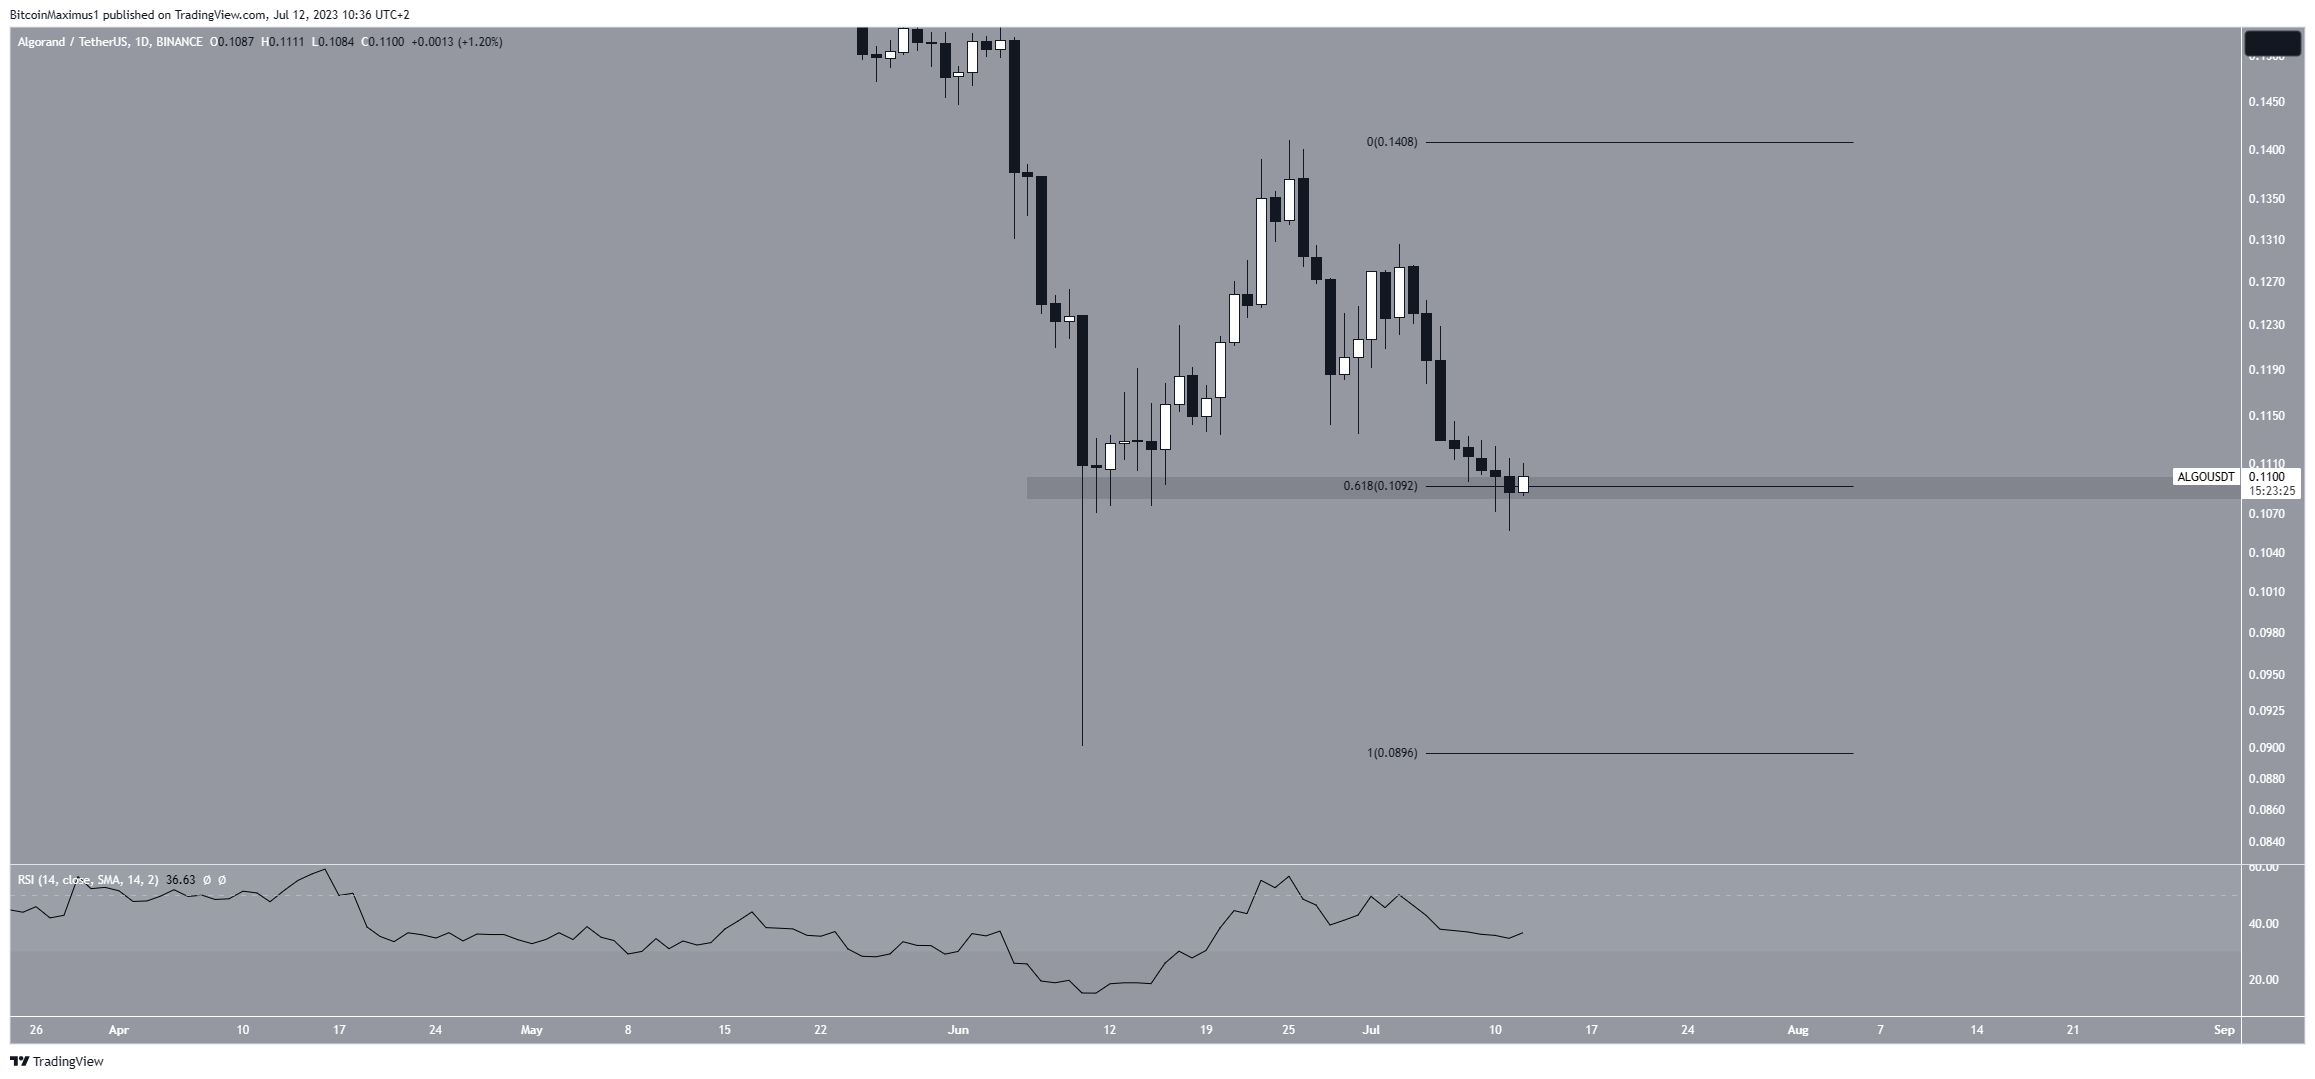
Currently, the ALGO price trades just above the 0.618 Fib retracement support level at $0.11. The theory of Fibonacci retracement levels suggests that after a substantial price move in one direction, the price will partially retrace or return to a prior price level. The 0.618 Fib level is crucial in determining whether the decrease is corrective.
If the price closes below it, it usually means that the trend is bearish. However, if the price bounces, it is a sign that the correction is complete.
So, this will likely be the case for ALGO. A breakdown below the area can lead to a drop to $0.09, while a bounce will likely test the previous June highs at $0.14.

The daily RSI does not help in determining the future trend. The indicator is below 50 but has created a higher low. So, it does not confirm if the price will bounce or break down.
To conclude, the reaction to the $0.11 area will likely determine the future ALGO price prediction. A breakdown below it can lead to a quick fall to $0.09, while a bounce will likely cause an increase to $0.14.
 beincrypto.com