On June 30, the price of Bitcoin Cash (BCH) reached a new yearly high, extending a remarkable rally that commenced on June 10.
Thus far, the BCH price has surged by an impressive 200% without experiencing any significant pullback. However, based on the wave count analysis, a temporary decline in the near future is possible before the price resumes its upward movement.
Bitcoin Cash Double Bottom Leads to Rally
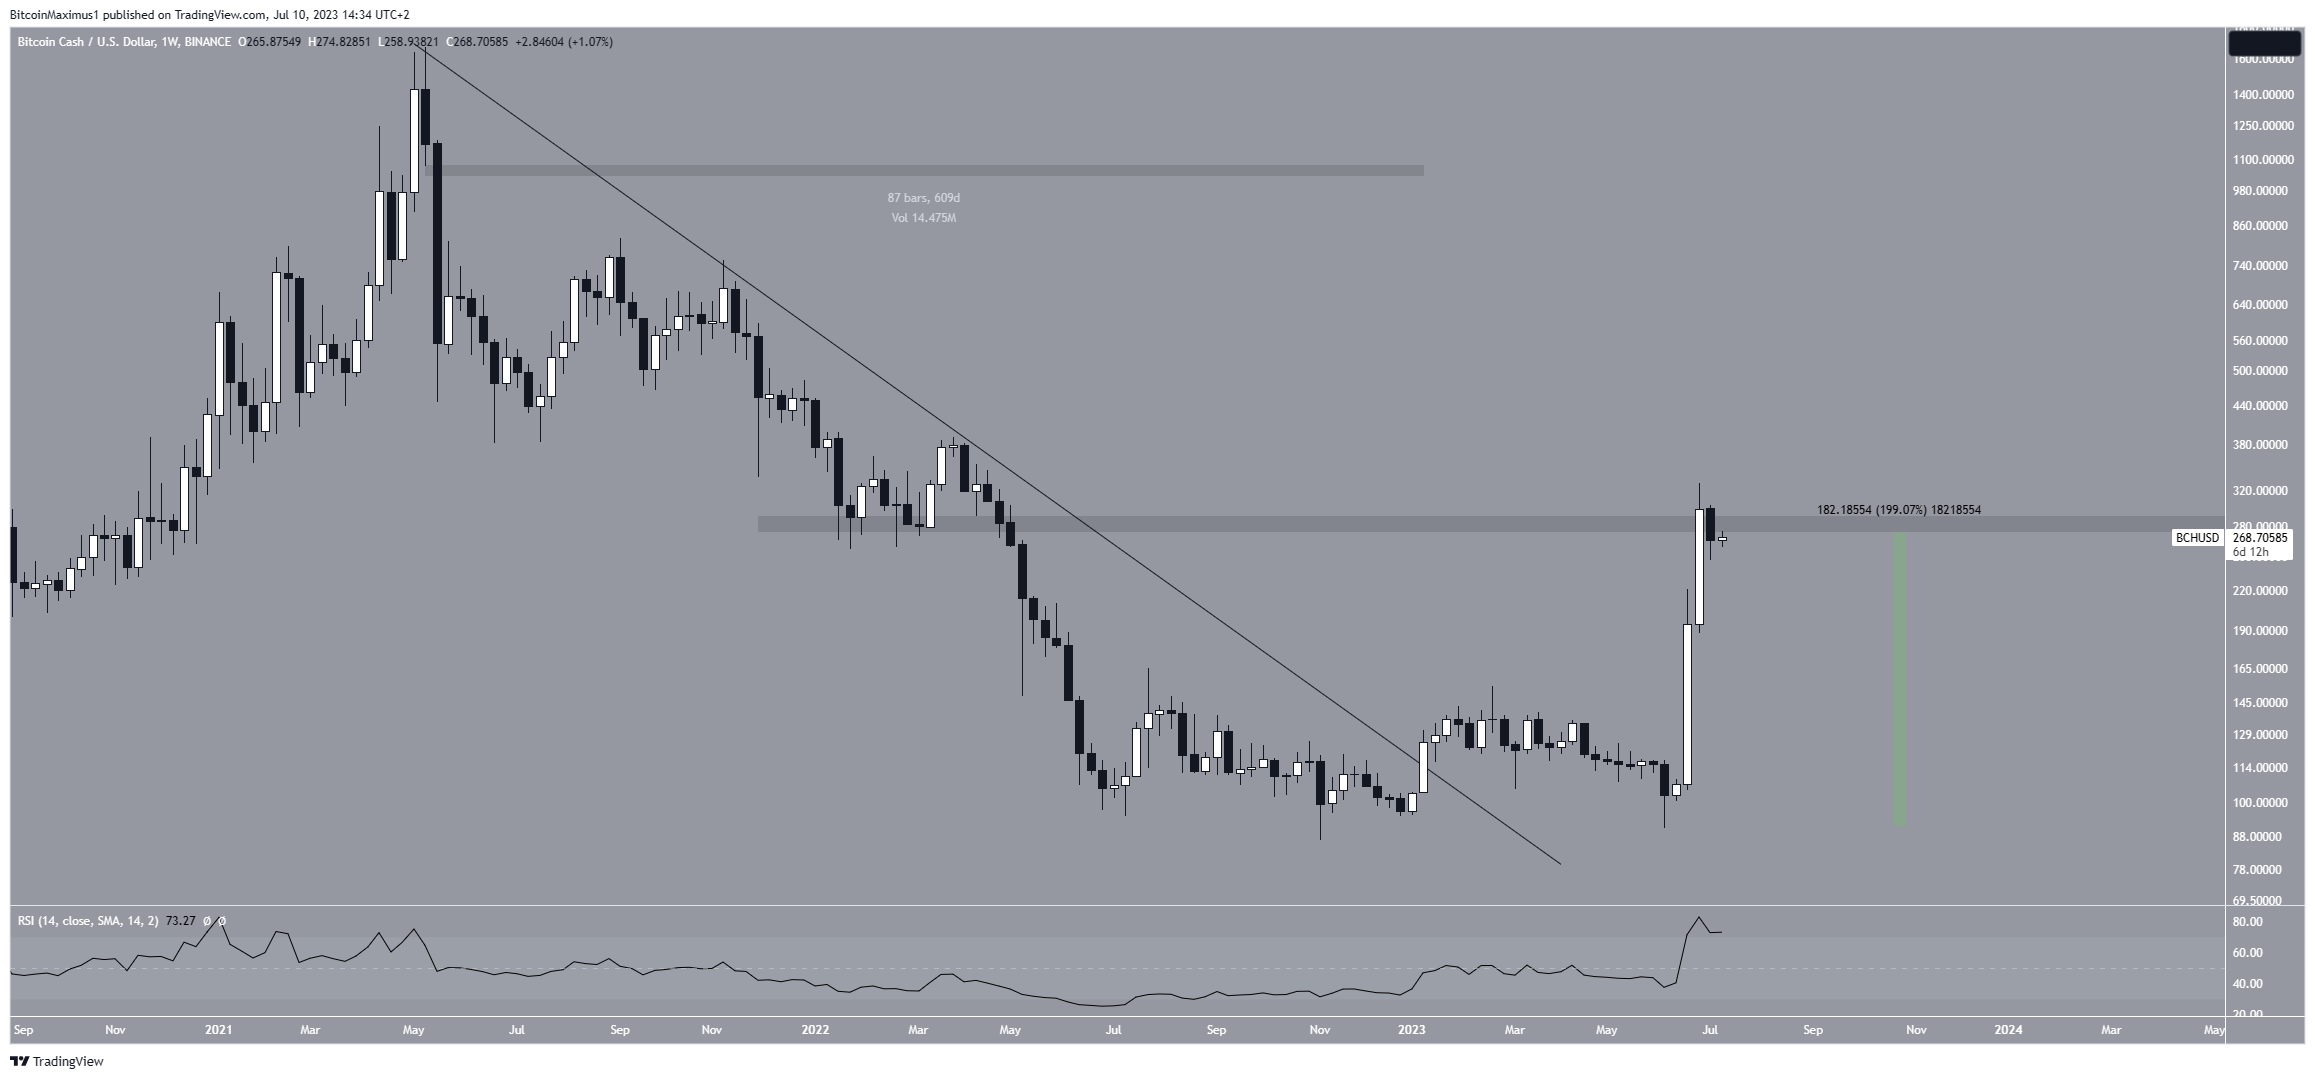
A look at the technical analysis for the weekly time frame shows that the BCH price has fallen under a long-term descending resistance line since May 2021. While doing so, BCH fell to a low of $86, which was only slightly above the all-time low of $81, reached in December 2018.
However, the BCH price has increased significantly since. At the beginning of January 2023, the price broke out from a descending resistance line. At the time, the line had been in place for 609 days.
Read More: 9 Best Crypto Demo Accounts For Trading
While BCH fell to its pre-breakout levels in June, it bounced sharply after completing a double bottom pattern (green icons). The double-bottom is considered a bullish pattern and often leads to significant upward movements. Since then, the BCH price has increased by roughly 200%.
Currently, BCH trades slightly below the $285 area, the reaction to which is crucial for the future trend.

The weekly RSI supports the continuation of the increase. The RSI is a momentum indicator used by traders to evaluate whether a market is overbought or oversold and to determine whether to accumulate or sell an asset.
Readings above 50 and an upward trend suggest that bulls still have an advantage, while readings below 50 indicate the opposite. The indicator is above 50 and increasing, both signs of a bullish trend.
BCH Price Prediction: Is the Correction Complete?
A look at the shorter-term daily time frame gives a positive outlook, mostly relating to the wave count.
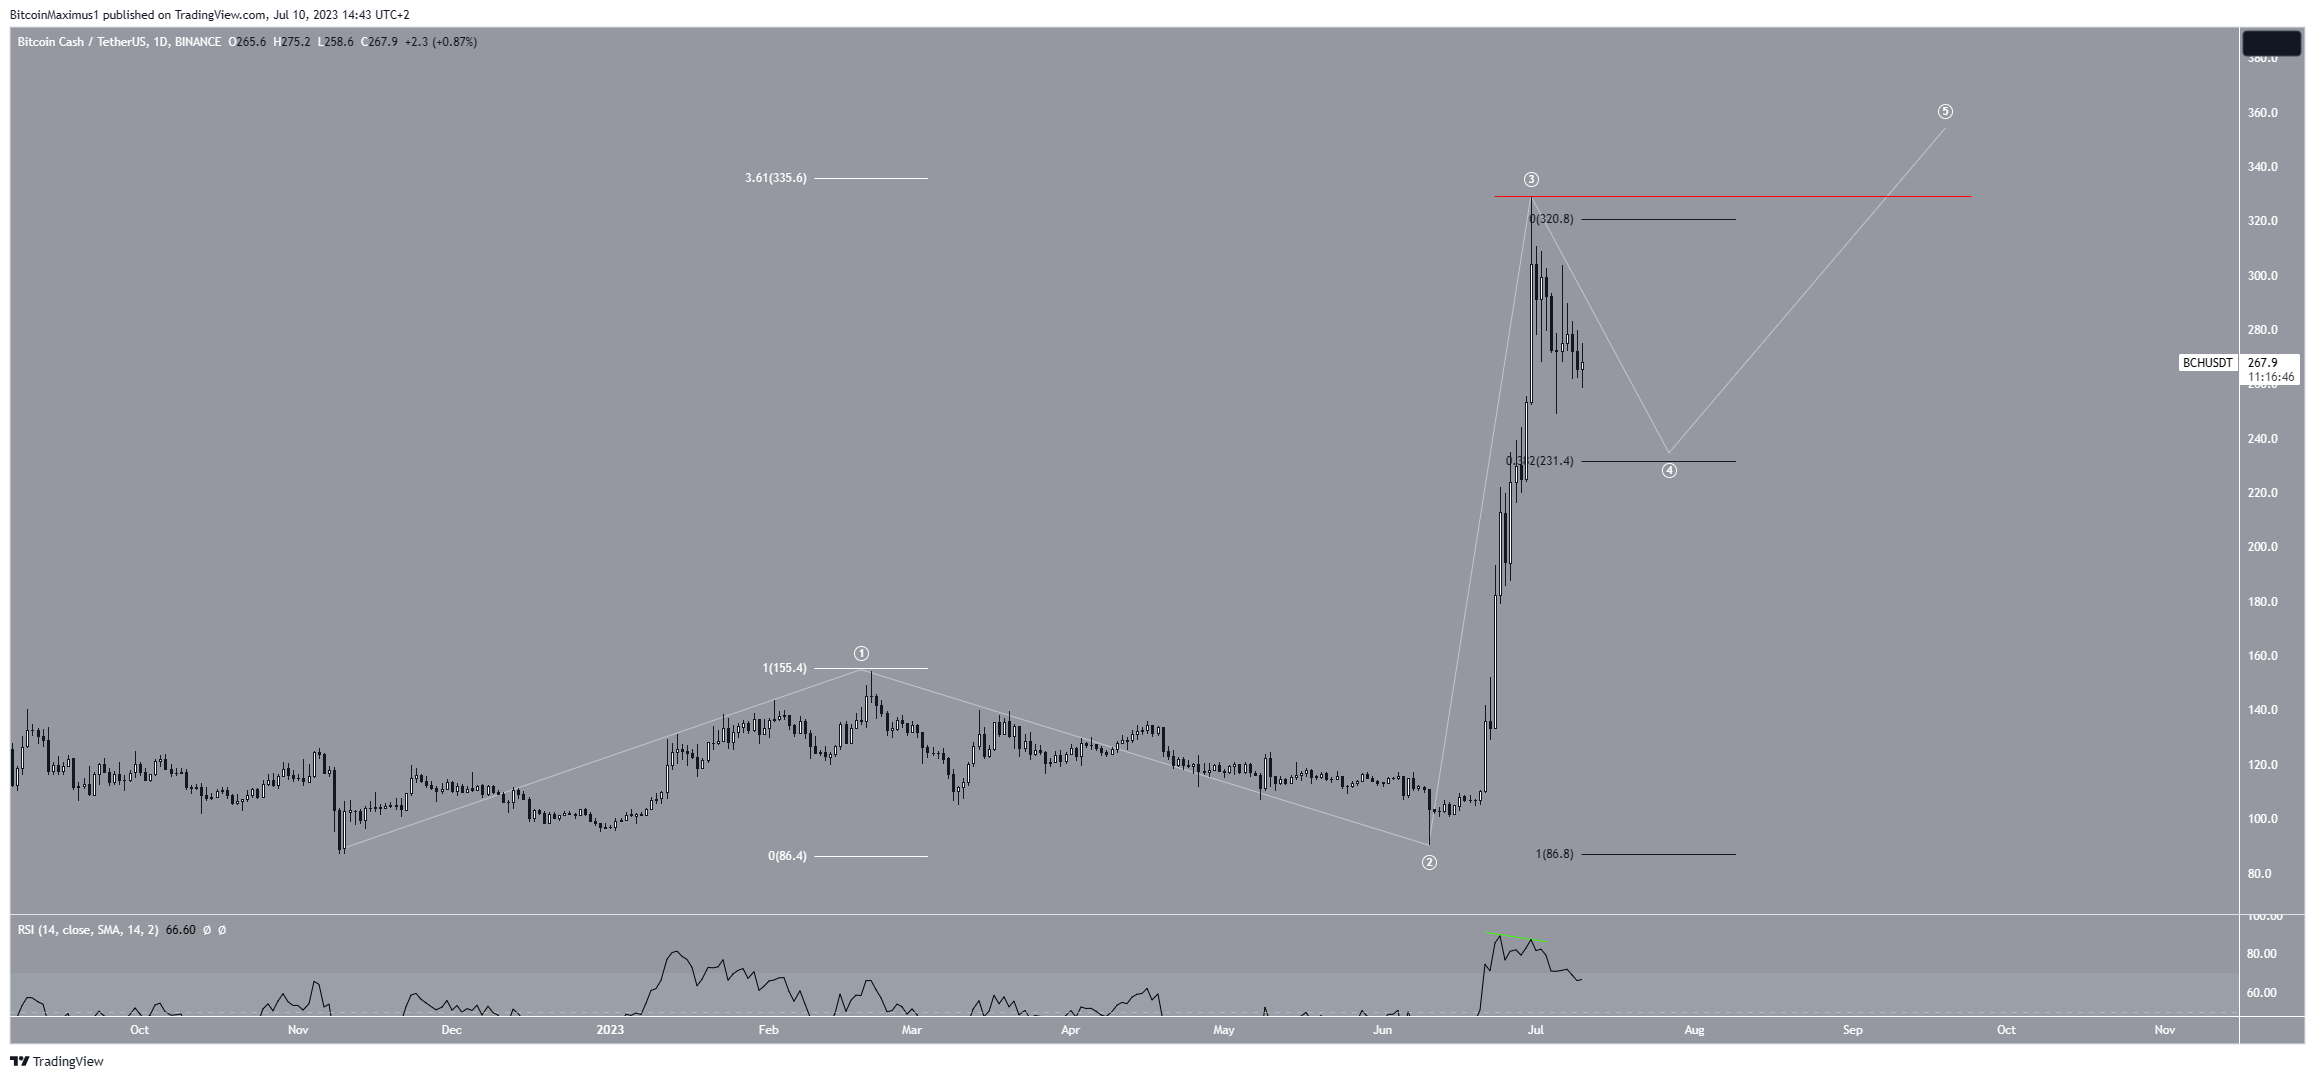
In the long run, the wave count indicates a strong bullish trend. However, it also predicts a short-term decrease. Analysts who employ the Elliott Wave theory examine repetitive long-term price patterns and investor psychology to determine the direction of the trend.
Given the significant surge, the wave count suggests that the current BCH price has reached the top of the third wave of a five-wave upward movement (white). This third wave is typically the most intense among the bullish waves.
Up until now, the length of wave three has been 3.61 times that of wave one, which demonstrates an impressive extension level for wave three, although not an unprecedented one.
However, the price reached a local top on June 30 after the RSI generated a bearish divergence. This is an occurrence in which a momentum decrease accompanies a price increase. The price has likely reached the top since it transpires at the 3.61 extension.

Despite this short-term bearish BCH Price prediction, surpassing the red line representing the yearly high at $329 would indicate that the overall trend remains bullish.
The rally could potentially carry on toward the next resistance level at $360 in such a scenario.
 beincrypto.com