Despite facing a challenging period in recent months, the price of Litecoin has demonstrated a significant upward trajectory. In June, $LTC experienced a decline to $71; however, the bulls subsequently took charge and initiated a recovery.
Nevertheless, over the past week, $LTC’s progress slowed, with the coin retracing below the $100 mark and experiencing a loss of approximately 12%. On the daily chart, $LTC witnessed a 1.5% decline.
Although the coin experienced a significant devaluation on the weekly chart, the bullish sentiment remains. The technical analysis of Litecoin indicates that the bulls are currently dominant, with a minor retracement in demand and accumulation.
As Bitcoin also retraced on its chart recently, other altcoins, including Litecoin, observed depreciation. Currently, Litecoin is in a crucial price zone ranging from $90 to $94. Sustaining a price above the $94 mark is expected to provide impetus for $LTC to resume its upward trajectory. The market capitalization of $LTC reflects a higher presence of sellers compared to buyers in the market.
Litecoin Price Analysis: One-Day Chart
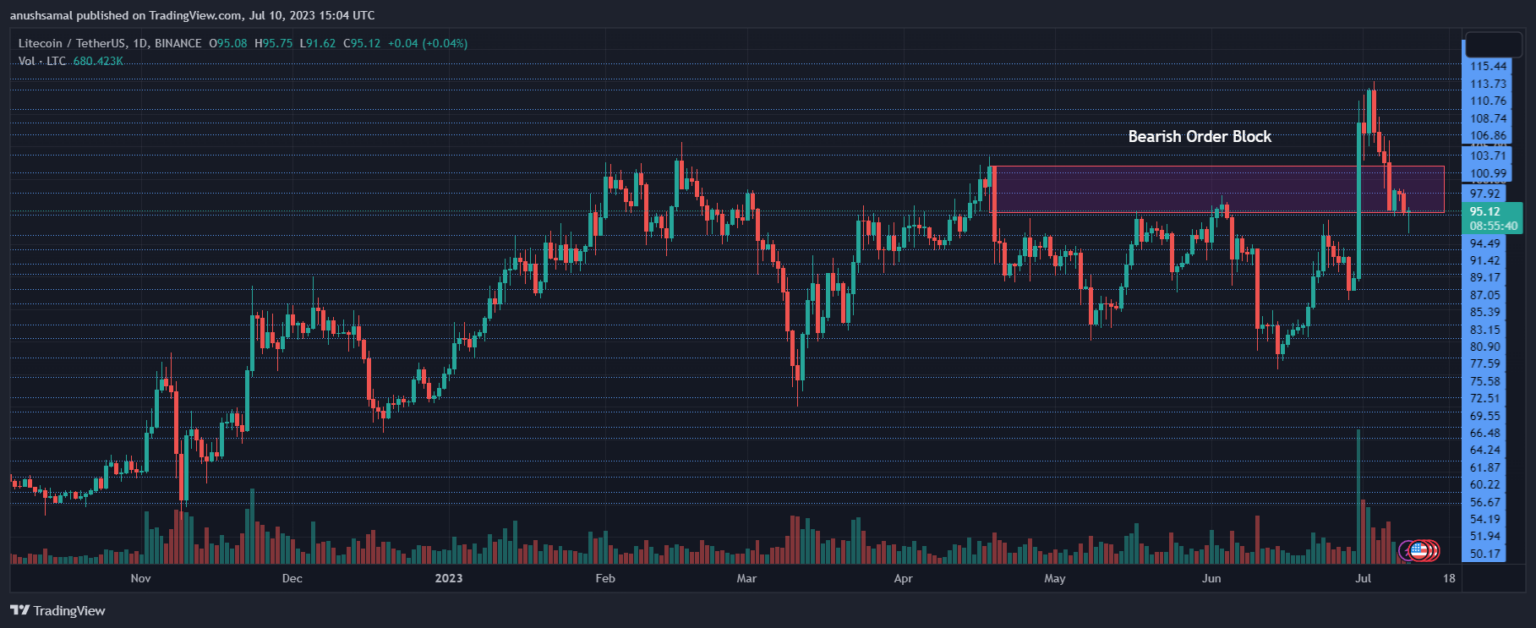
As of the time of writing, $LTC was priced at $95. The altcoin attempted to increase in value after successfully holding the $94 support level. The immediate resistance for $LTC was observed at $97.
The bullish sentiment remained intact for $LTC as it managed to stay above the bearish order block (marked in red) formed in mid-April.
Surpassing the $97 mark would propel Litecoin to challenge the $100 threshold and potentially move beyond the upper boundary of the bearish order block at $103.
Conversely, if $LTC fails to maintain its current level, there is a risk of breaching the $94 support, which may invite the bears back into the market.
Technical Analysis
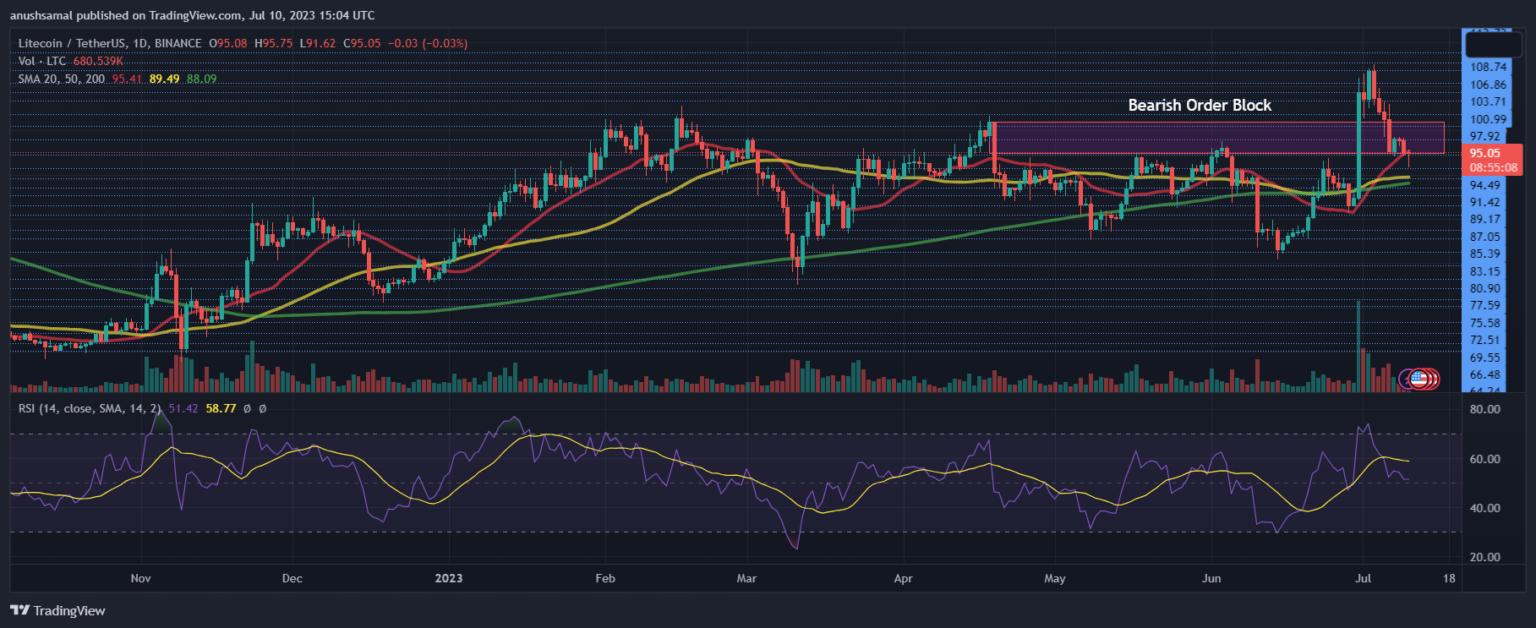
Following its surge above the $100 threshold, $LTC experienced a pullback as it entered an overbought condition. However, the Relative Strength Index (RSI) remained slightly above the half-line, indicating that buyers still maintained control in the market, particularly as the coin held above the crucial support level.
Furthermore, $LTC remained above the 20-Simple Moving Average line, signaling buyers were driving the price momentum. $LTC needs to surpass the immediate resistance level in the upcoming trading sessions to sustain its upward trajectory.
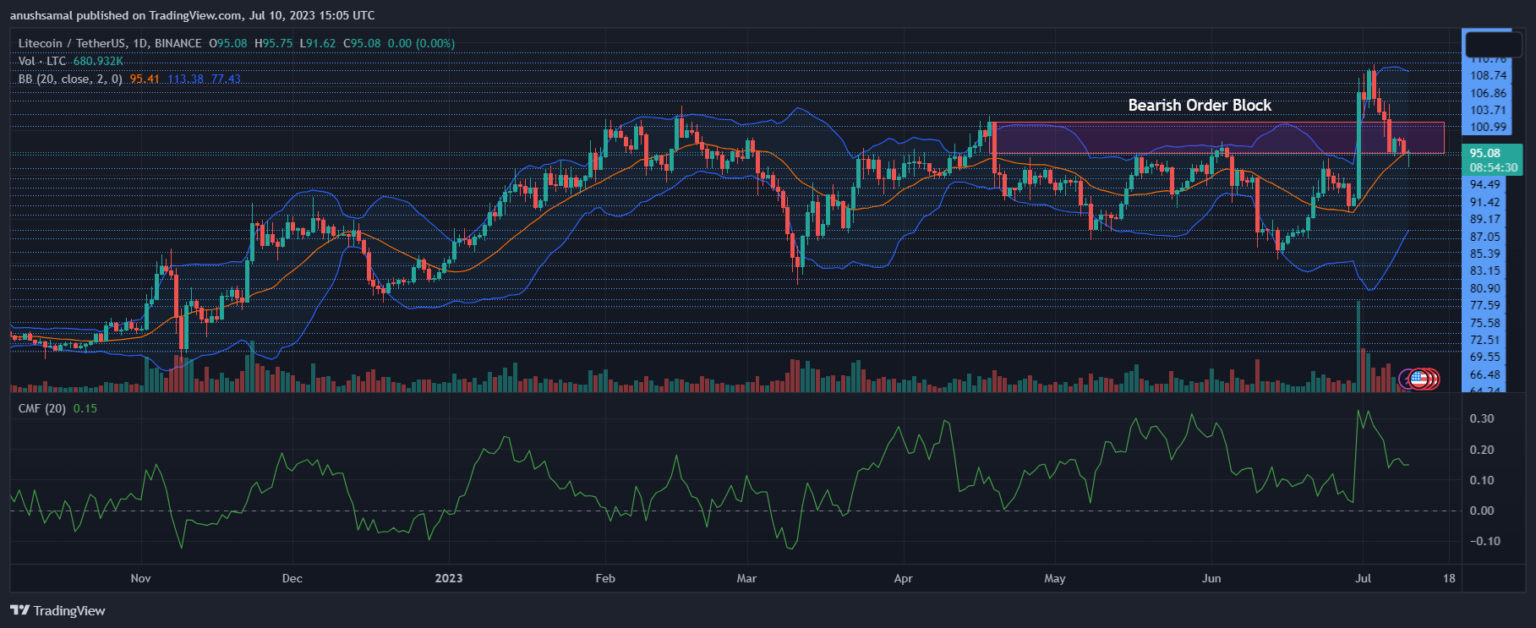
$LTC has experienced notable capital inflows, indicating that investor interest has remained positive, as evidenced by the Chaikin Money Flow indicator.
This indicates a sustained bullish outlook on the chart. Furthermore, the Bollinger Bands, which reflect price volatility and fluctuation, are currently wide open. This suggests that $LTC may undergo significant price action and volatility in the upcoming trading sessions.