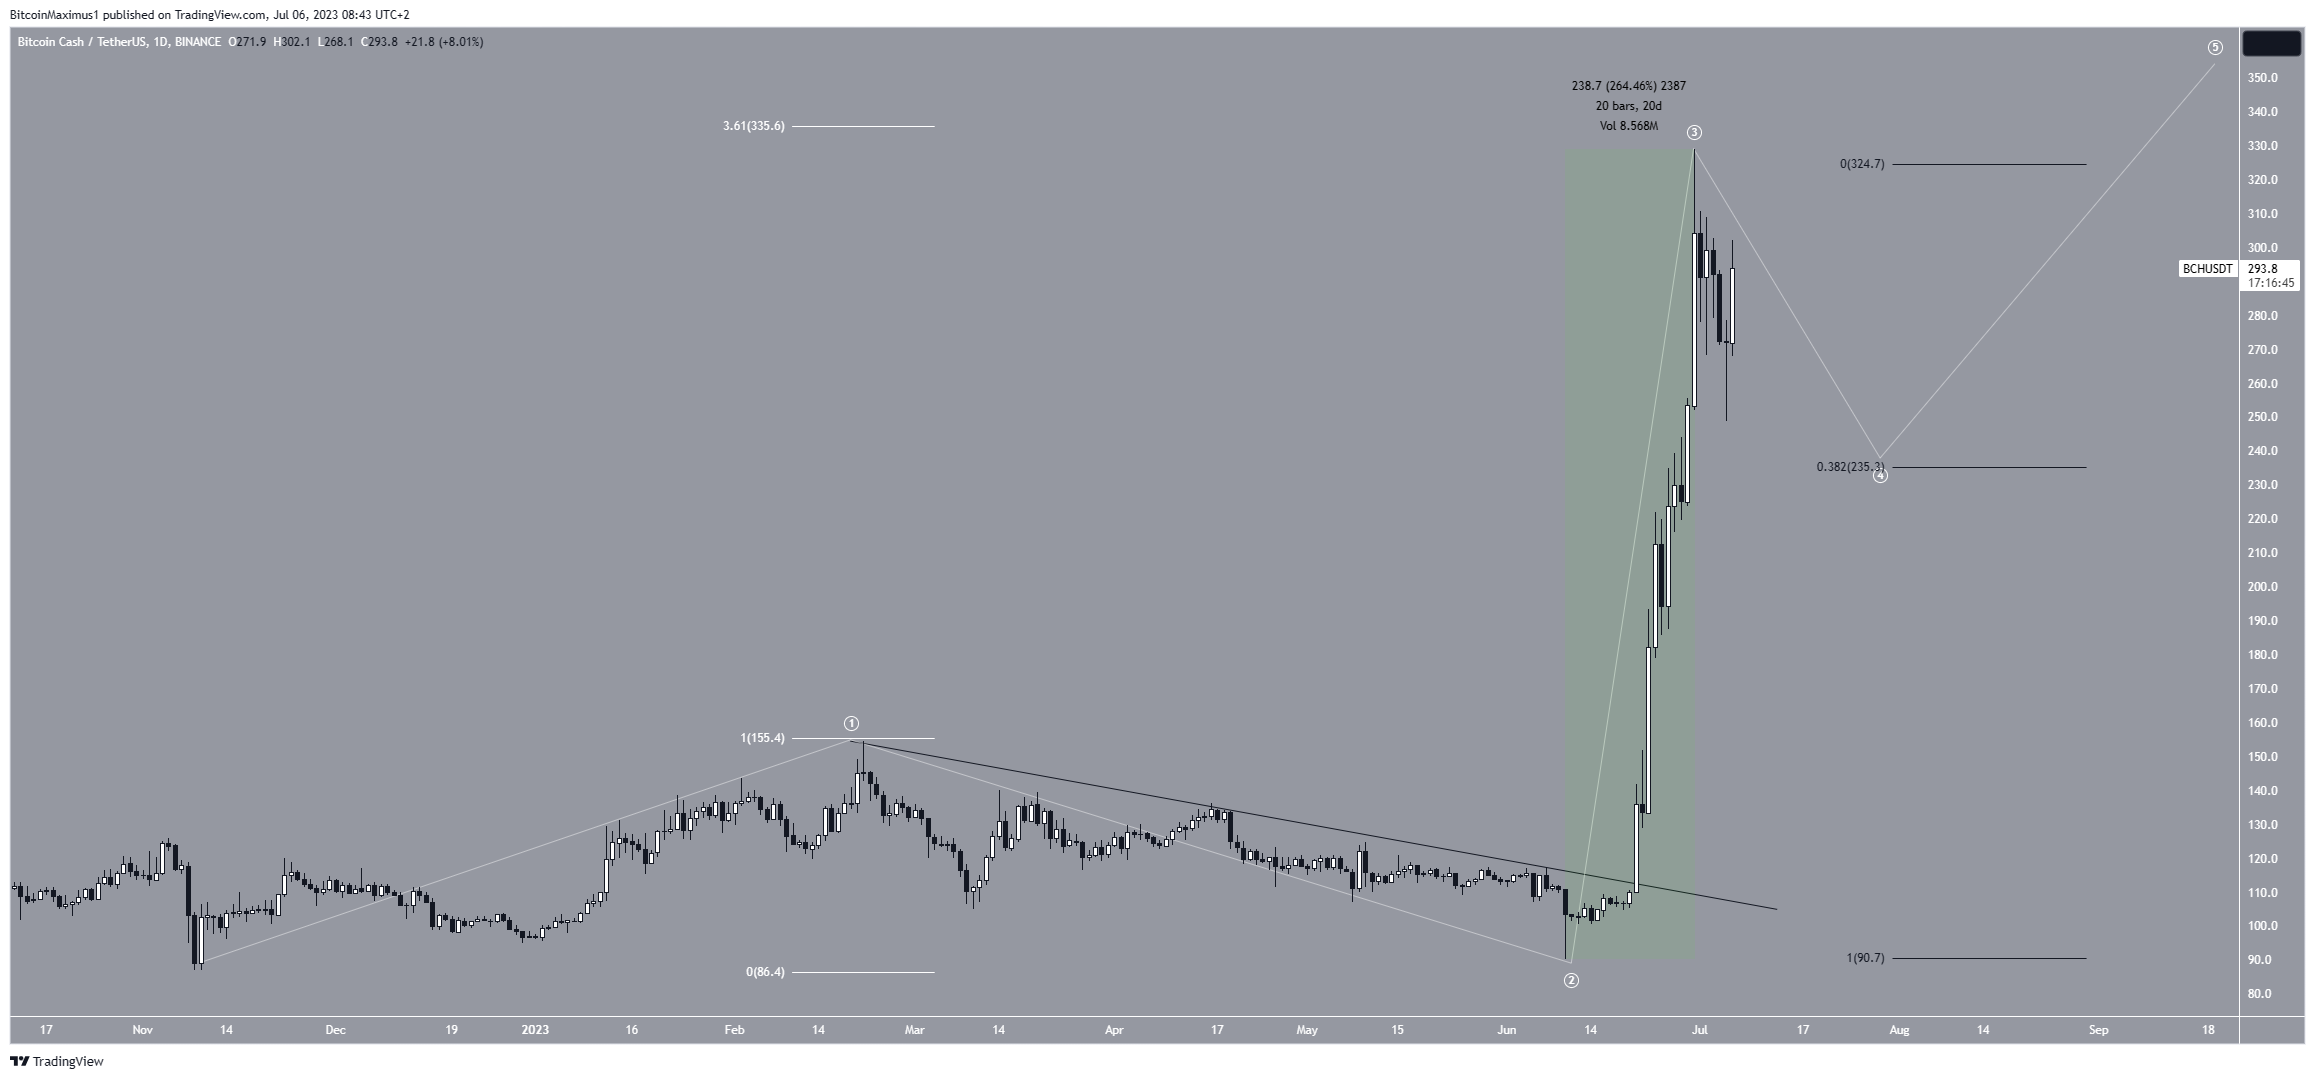
The Bitcoin Cash (BCH) price reached yet another new yearly high on June 30, continuing an impressive rally that began on June 10.
So far, the BCH price has increased by 260% without providing any retracement at all. Due to the wave count, a short-term drop may occur before the price resumes its increase.
Bitcoin Cash (BCH) Price Breaks Through $300 in Impressive Rally
The BCH price has been on an absolute tear since falling to a new yearly low of $90 on June 10. 11 days later, the price broke out from a descending resistance line that had been in place since February. This confirmed that the correction is complete and new highs will follow.
Read More: Best Upcoming Airdrops in 2023
However, the increase since the breakout has been nothing short of unprecedented for BCH. The price increased by 260% without experiencing any retracement, leading to a new yearly high of $320 on June 30. This is the highest price since April 2022.

The wave count is decisively bullish in the long term. Technical analysts utilize the Elliott Wave theory to ascertain the trend’s direction by studying recurring long-term price patterns and investor psychology. Due to the sharpness of the increase, the wave count suggests that the BCH price is currently in wave three of a five-wave increase (white). This is often the sharpest out of the bullish waves.
Until now, wave three has had 3.61 times the length of wave one, an impressive but not unprecedented level of extension for wave three.
Read More: Best Crypto Sign-Up Bonuses in 2023
BCH Price Prediction: Has a Local Top Been Reached?
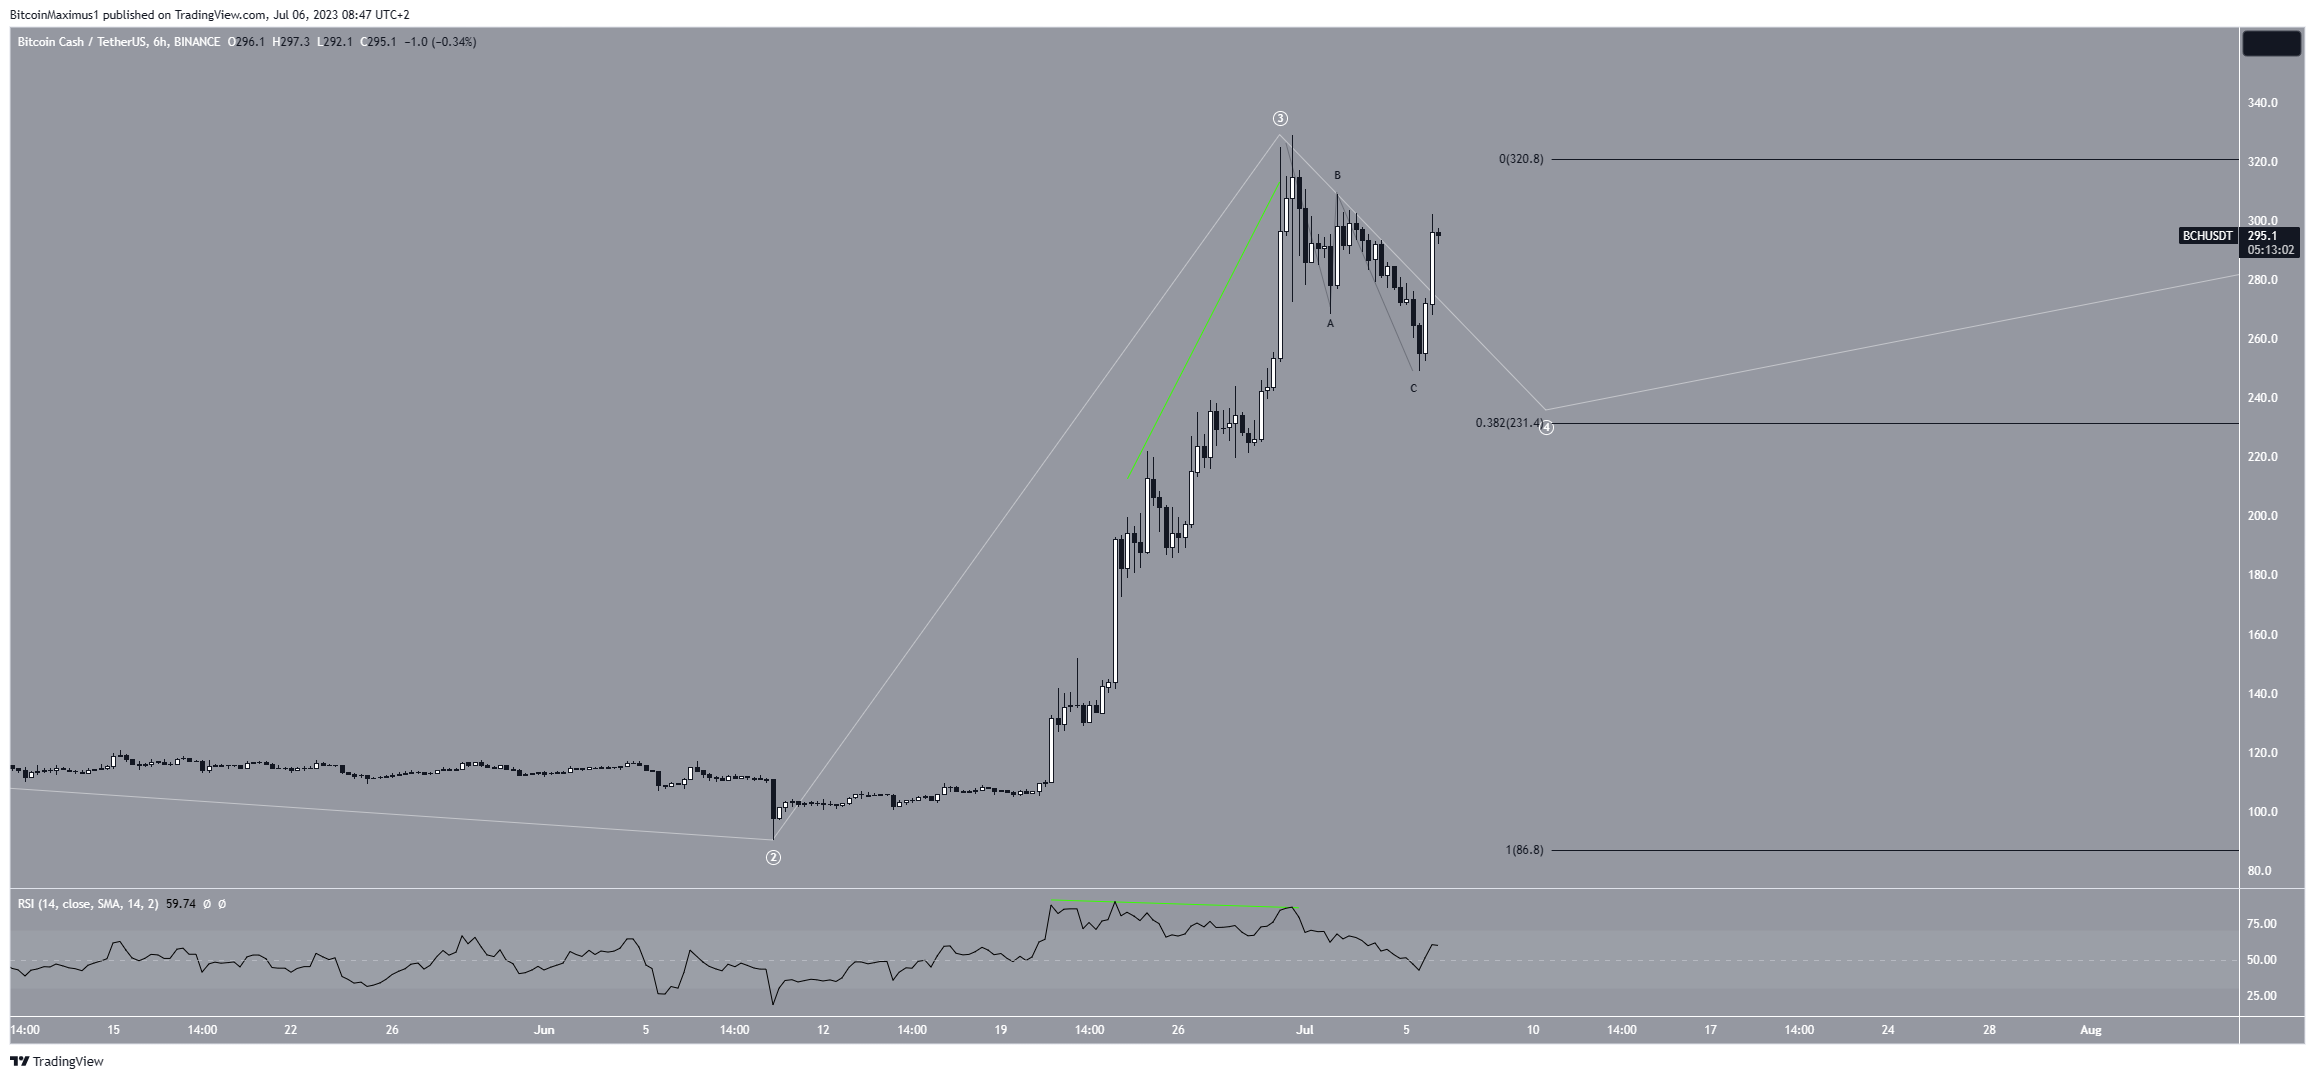
A closer look at the short-term six-hour technical analysis indicates that the price might have reached a local top. The reasons for this come from both the RSI and the wave count.
Firstly, the six-hour RSI gives a bearish reading. Traders utilize the RSI as a momentum indicator to assess whether a market is overbought or oversold and to determine whether to accumulate or sell an asset. The indicator is falling, generating a bearish divergence (green line). This is an occurrence in which a momentum increase does not accompany a price increase. A downward movement often follows it.
Secondly, the short-term wave count shows that the price has completed an A-B-C corrective structure. However, since it has not yet reached the $235 Fib support level, it is possible that the decrease is just the first wave of a larger A-B-C structure.
This would also be more in line with the length of wave three. As it stands, wave four is extremely short compared to wave three, which it is correcting.

Despite this bearish short-term BCH price prediction, moving above the yearly high of $329 (red line) will mean that the trend is still bullish. In that case, the rally could continue to the next resistance level of $360.
 beincrypto.com