Bitcoin (BTC) analysis
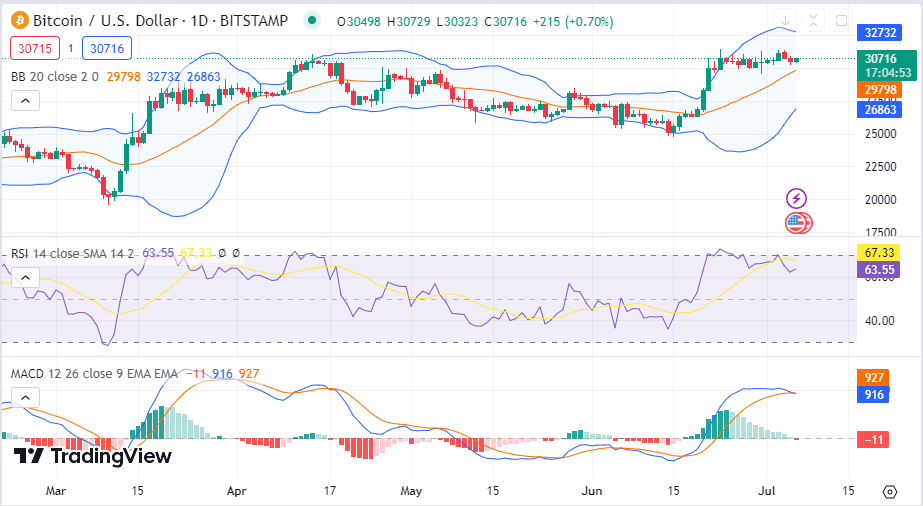
As of press time, the global market capitalization has dropped 0.7% in 24 hours of trade, reaching $1.2T. The markets are performing pretty brutally. Bitcoin (BTC) is having a quiet day, down 0.2%, with a price of $30.7K as of press time as the cryptocurrency continues encountering resistance near the $31K mark.
As the Bollinger bands approach each other, volatility in Bitcoin prices also decreases. The bears’ struggle for control of BTC is shown by the RSI’s current position below the average line and the MACD’s recent crossover to the negative side.
Ethereum (ETH) analysis
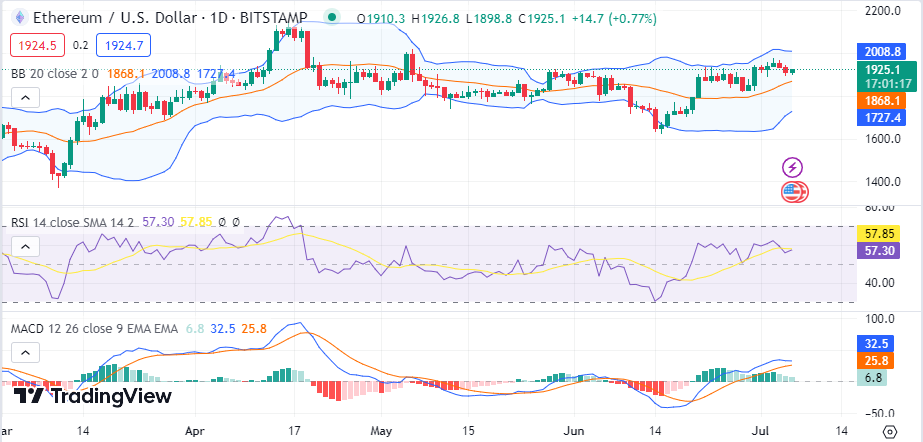
Ethereum (ETH) is likewise enjoying a sluggish day, with prices now at $1925, down 0.6% from the previous day. However, trade activity for the asset has climbed by 27% within the same period, reaching $6 billion.
As the Bollinger bands gradually move closer together, volatility in ETH is also diminishing. The RSI is also approaching a crossover below the average line, which indicates that bears are attempting to gain control of the ETH market. Even the MACD indicator, which has shown that bulls are in control until now, is on the verge of switching to the bearish side.
Storj analysis
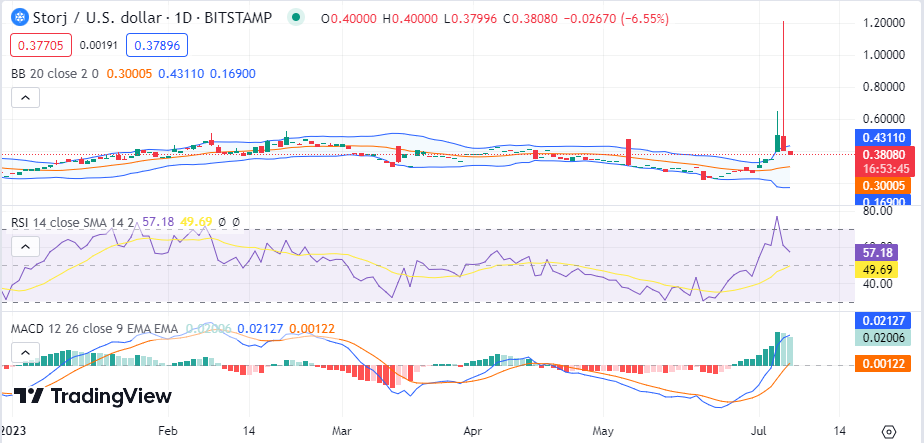
Even though Storj is one of the top trending cryptocurrencies right now, its price is down 28% from a day ago, and its trading volume is down 16% from a day ago, totalling about $530 million.
As network activity increases, the Bollinger bands diverge, indicating more volatility on Storj. With bears pressing for a crossing below the average line into the oversold area, the relative strength indicator moves just above the average line as it breaks into a negative trend.
FTT analysis
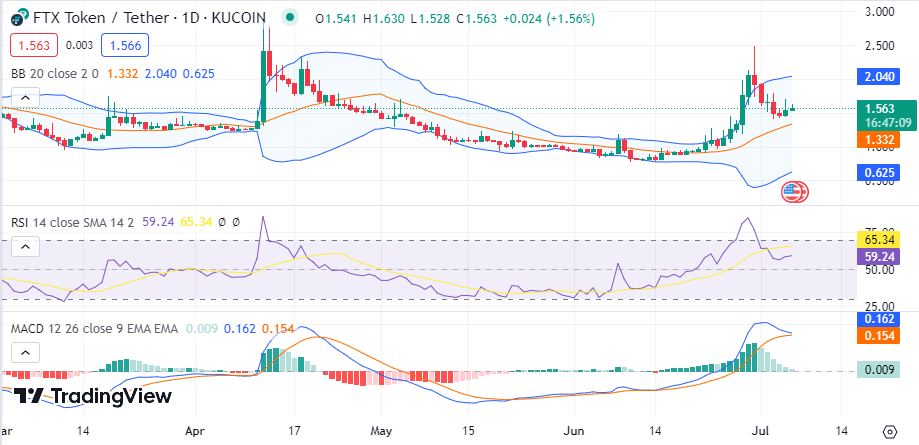
The native token of the FTX, FTT, continues to rise sharply for a second day. The price of FTT has increased by 6% to $1.56 in the last 24 hours, while trade volume has increased by 82% to $56M.
However, the volatility levels of FTT are unclear since the Bollinger bands keep a not-so-close, not-so-far distance from one another. However, the RSI indicator drifts below the average line, indicating that bulls and bears are engaged in a tight battle; meanwhile, the MACD indicator is very near to shifting to the other side.
Bitcoin SV (BSV) analysis
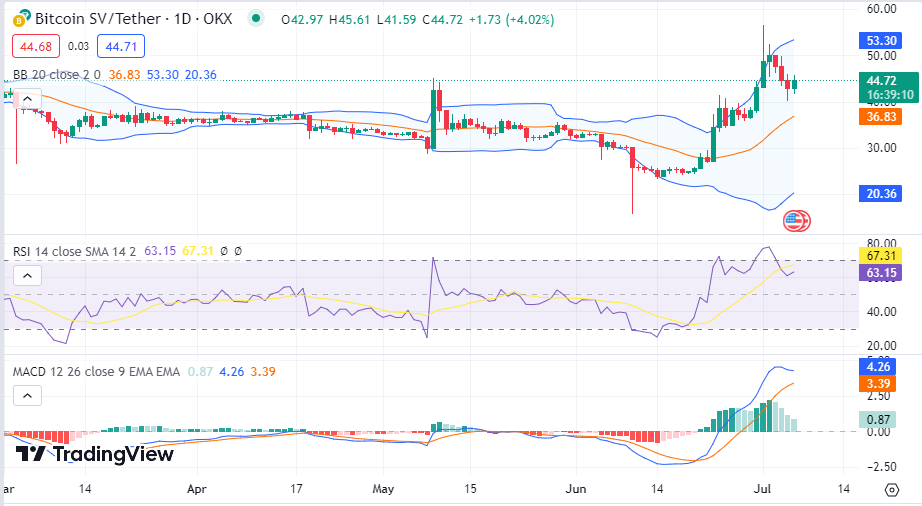
Bitcoin SV is also making massive moments in today’s session as the asset trades 5% above its previous 24-hour price, as the weekly gain now stands at 22%. BSV, with a current price of $44.9, has seen a 40% surge in trading volume, as the market cap saw a 4% gain within the same period.
However, BSV’s volatility levels are rising as the Bollinger bands diverge from each other, indicating increasing volatility on Bitcoin SV. The RSI indicators are looking to cross above its average line as bulls look to take total control.
Another notable gainers in today’s market are eCash (XEC) which is sitting on massive gains of 13% within a day of trading as the trading volume rose by 117% within the same period. The 7-day gain is also 57% as bulls dominate the asset’s network.
