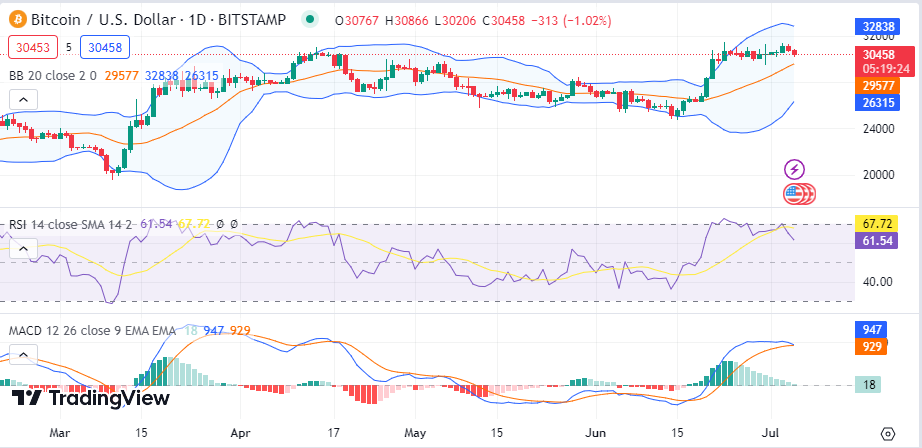
Bitcoin (BTC)
Bitcoin’s volatility levels are also decreasing as the Bollinger bands converge towards each other. The RSI is also below the average line as the MACD now approaches a shift to the negative side, showing the fight for dominance by bears on BTC.
Ethereum (ETH) analysis
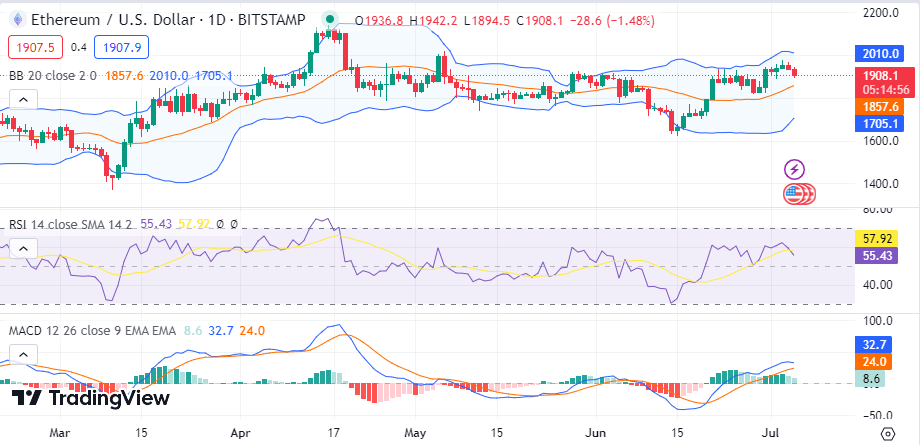
Ethereum (ETH) is also having a slow day as the asset trades at $1909, representing a 2% drop within 24 hours of trading. However, the asset’s trading volume has increased by 1.2% within the same period to reach $6B.
Eth’s volatility levels are also slowly decreasing as the Bollinger bands now converge towards each other. At the same time, the RSI moves below the average line indicating the effort by bears to dominate ETH markets.
Storj analysis
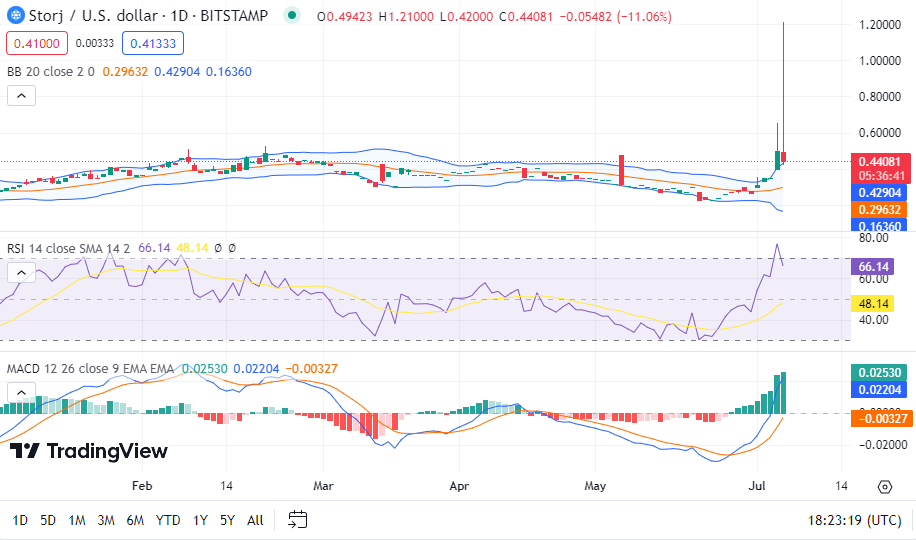
Storj, currently among the top most trending coins, is having a rather turbulent session as it trades 13% below its previous 24-hour price, as the trading volume currently sits on a 24-hour gain of 180% to take it.
The Bollinger bands, now diverging from each other, indicate increasing volatility on Storj as the activity levels on the network increase. The relative strength indicator is moving right above the average line as it breaks into a downward shift, with bears pushing for a crossover below the average line into the oversold region.
Verge (XVG) analysis
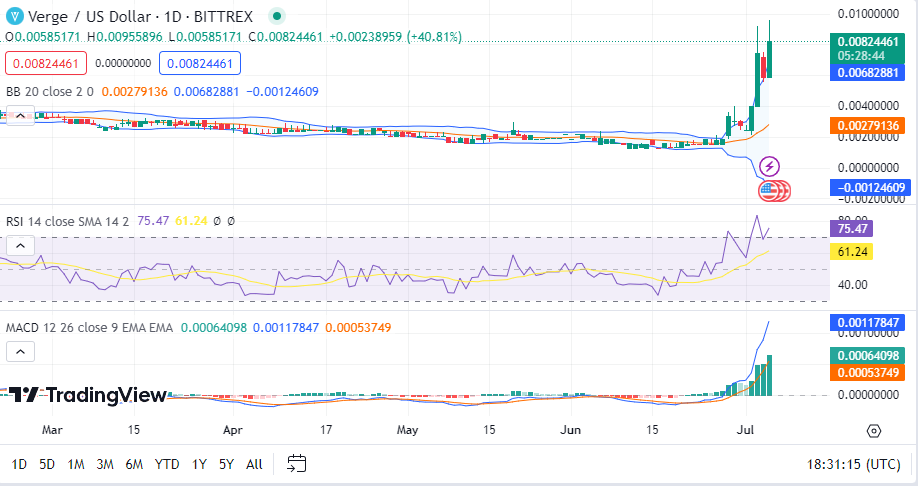
Verge is having a good market day as the asset trades 44% up from its previous 24-hour price to take it to $0.008296 as the trading volume now sits 47% up from its previous 24-hour as it now sits at $286M. Verge’s volatility levels are increasing as the Bollinger bands diverge from each other.
The Relative Strength Index indicator also moves above its average line in the overbought region, showing bull dominance on Verge. The MACD indicator is also above the positive region as the asset’s bulls dominate.
FTT analysis
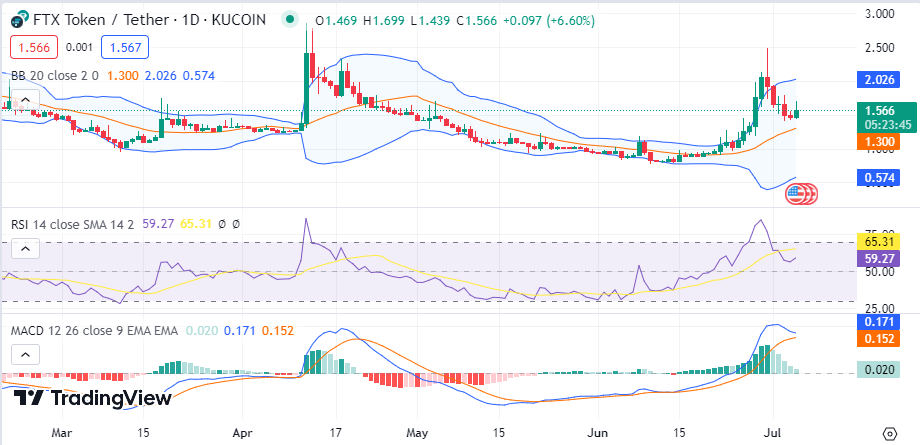
FTX’s native token, FTT, is again making trends as the news of the exchange’s comeback still hovers. FTT, currently trading at $1.58, has seen an 8% gain within 24 hours as the trading volume sees a 128% surge within the same period to take it to $63M.
FTT’s volatility levels are, howver, uncertain as the Bollinger bands maintain a not-so-close, not-so-far distance, indicating volatility uncertainty on the digital asset. The RSI indicator is, however, moving below the average line showing the struggle between bulls and bears as the MACD indicator also draws closer to a shift to the opposing side.
DOGE 2.0 analysis
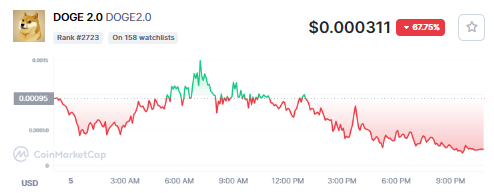
Doge 2.0 is having a turbulent session as the asset records a drop of 67% from its previous 24-hour price to take its price to $0.000311 as its trading volume currently stands at 1.81M. The memecoin is currently ranked at #2723 on CoinMarketCap.
Tosa analysis
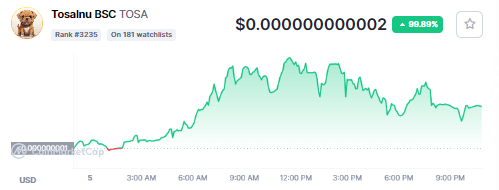
Tosalnu BSC (TOSA) is another notable gainer today, recording massive gains of close to 100% within a day of trading activity. The asset, currently with a market cap of 185.29K, has gained 99% in price valuation within 24 hours of trading to take its price to $0.000000000002 as bulls dominate the asset’s network. The assets now rank at #3235 on CoinMarketcap.
