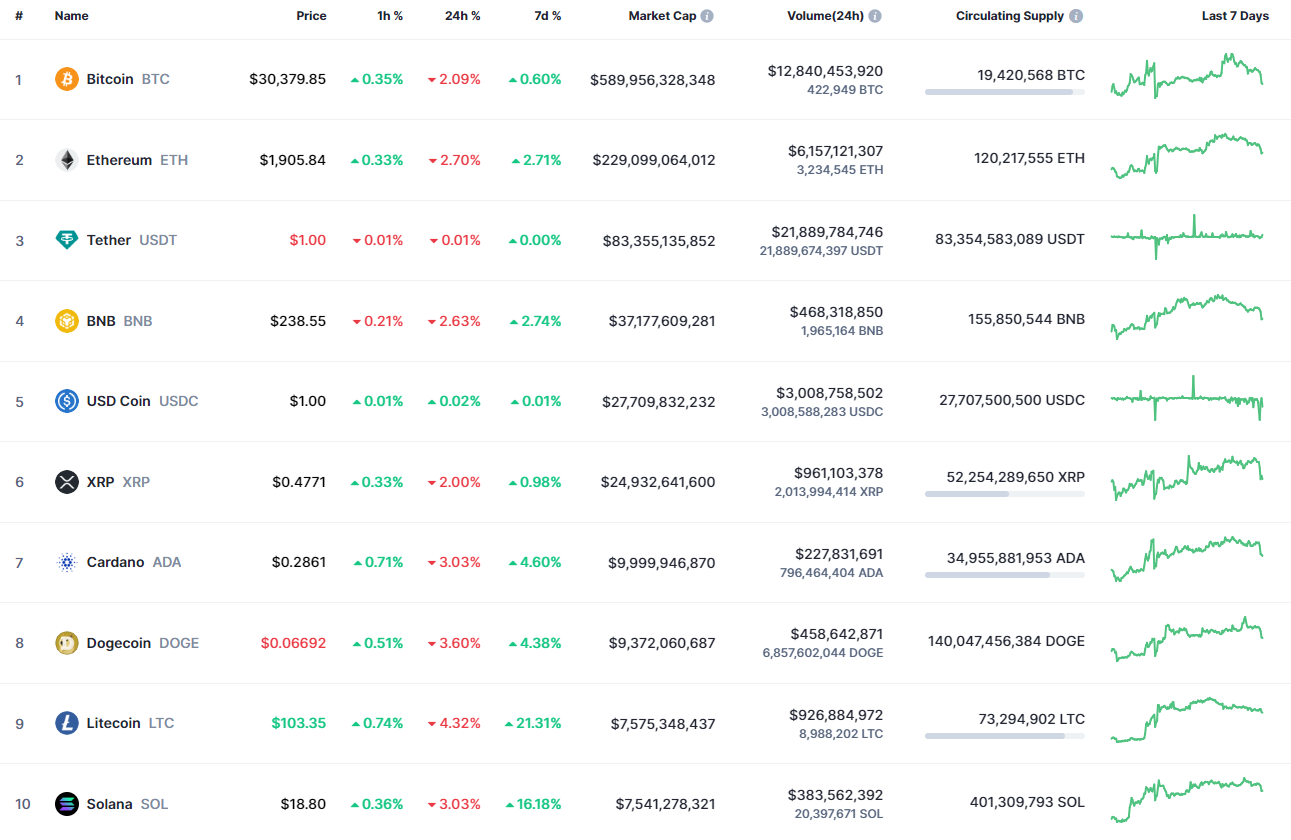
The market might have found a local peak as the rates of most of the coins are in the red zone.

Top coins by CoinMarketCap
AAVE/USD
The rate of AAVE has fallen by 4.89% over the last 24 hours.

Image by TradingView
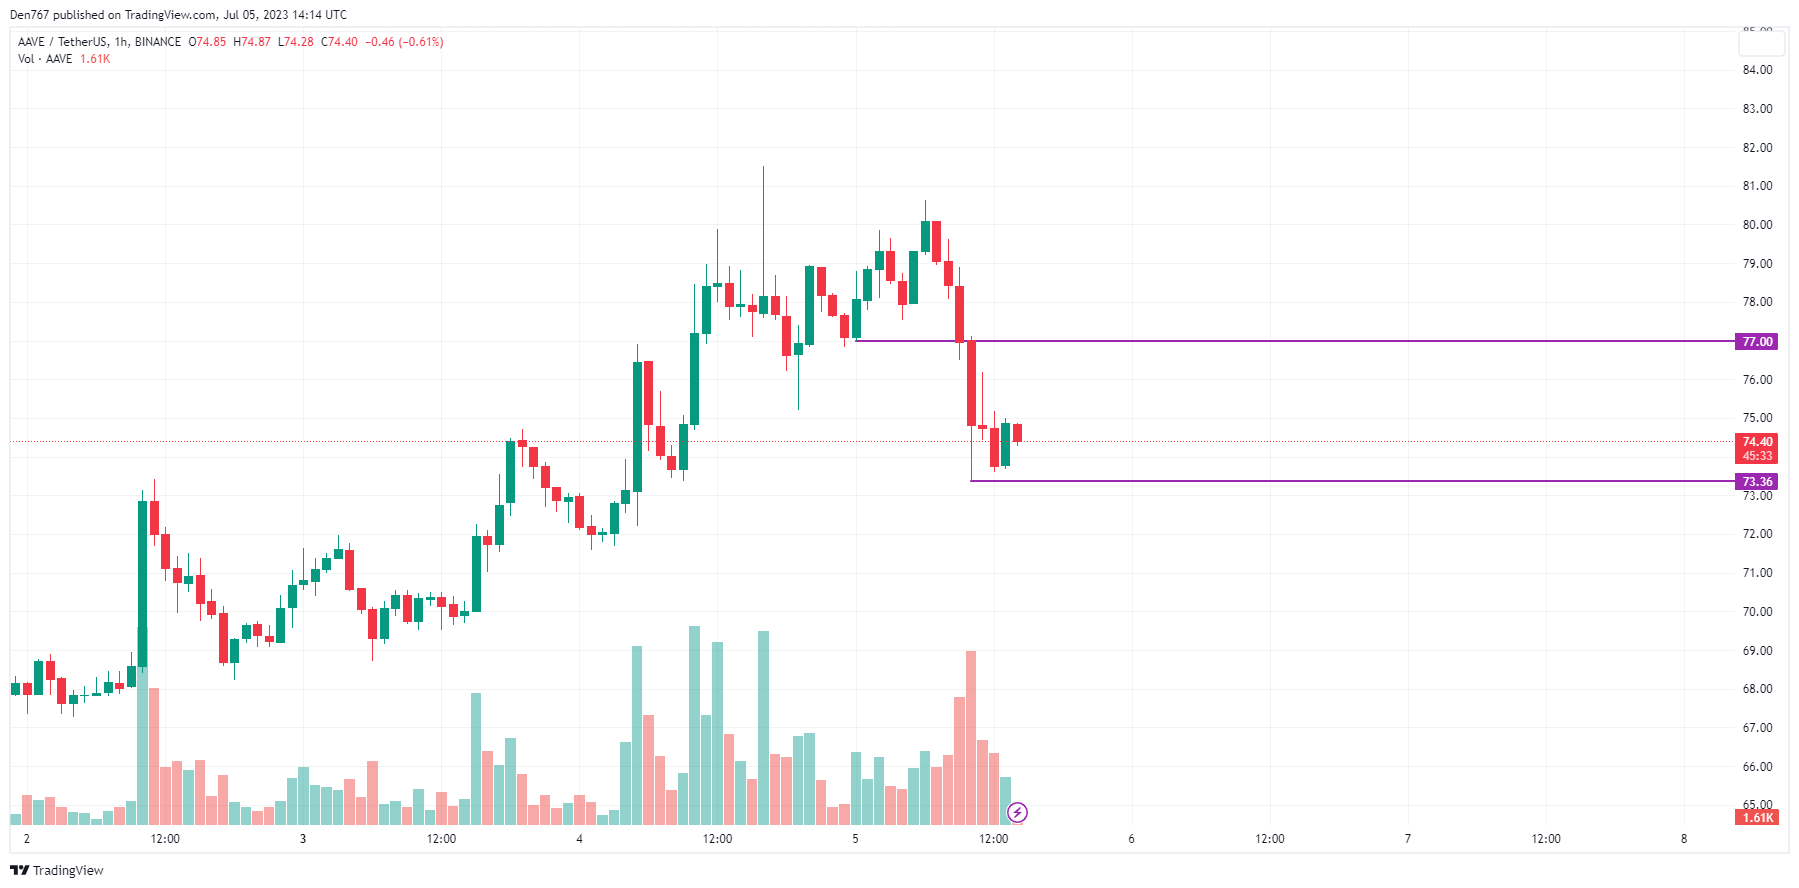
On the local chart, traders should focus on the resistance at $77. Until the rate is below that mark, bears are more powerful than bulls. Moreover, if the candle closes near the support level at $73.36, the drop is likely to continue to the $72-$71 area.

Image by TradingView
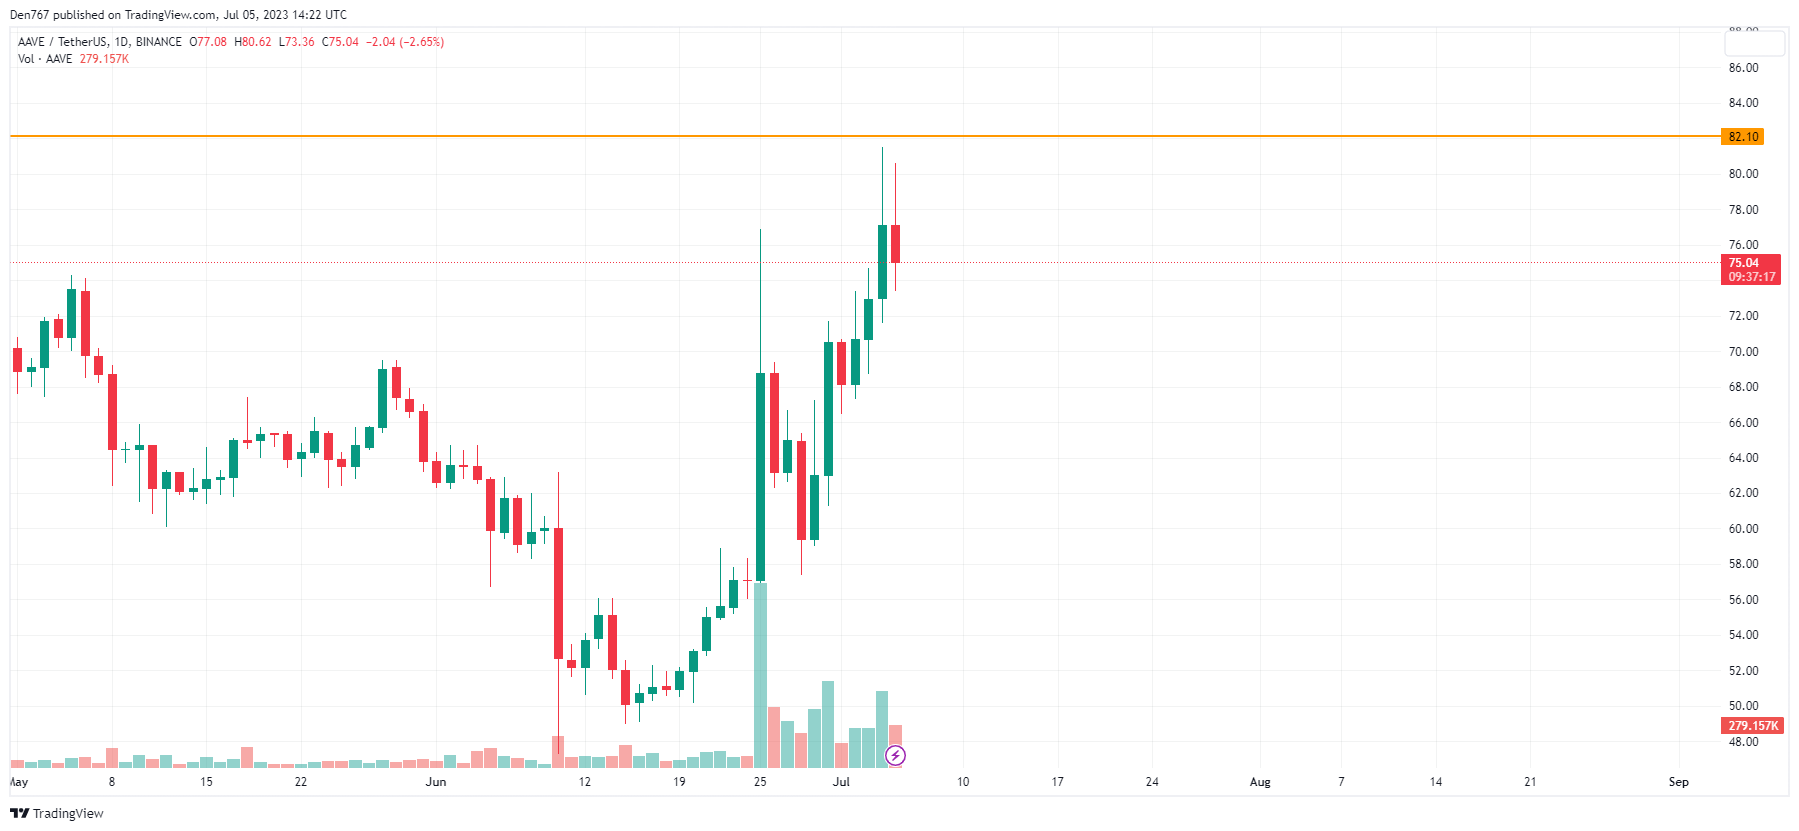
On the bigger chart, the rate of AAVE is neither bullish nor bearish as the price is far from the main levels. If buyers want to seize the initiative and return the coin to growth, they need to fix it above the $80 mark.
Only in that case can one expect a resistance breakout.

Image by TradingView
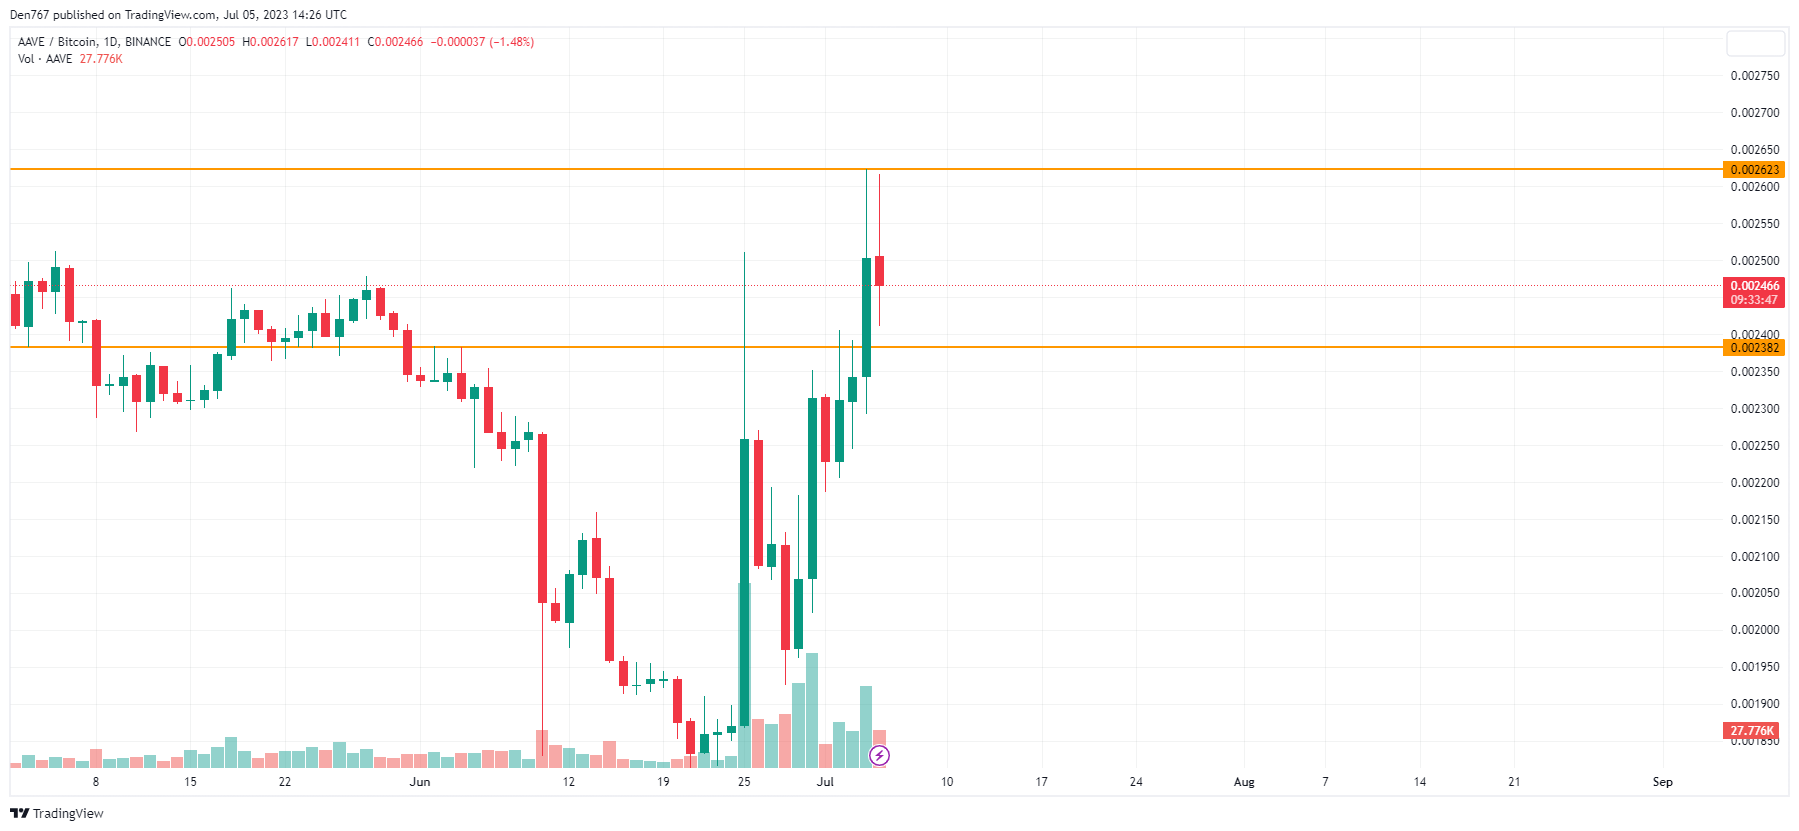
A similar situation can be seen on the daily chart against Bitcoin (BTC). The rate is stuck between the support at 0.002382 and the resistance at 0.002623. As none of the sides has seized the initiative yet, ongoing consolidation around 0.0025 is the more likely scenario until the end of the week.
AAVE is trading at $75.04 at press time.
 u.today