Most of the coins have entered a correction phase.
Top coins by CoinMarketCap
SHIB/USD
The rate of SHIB has declined by 0.65% over the last 24 hours.
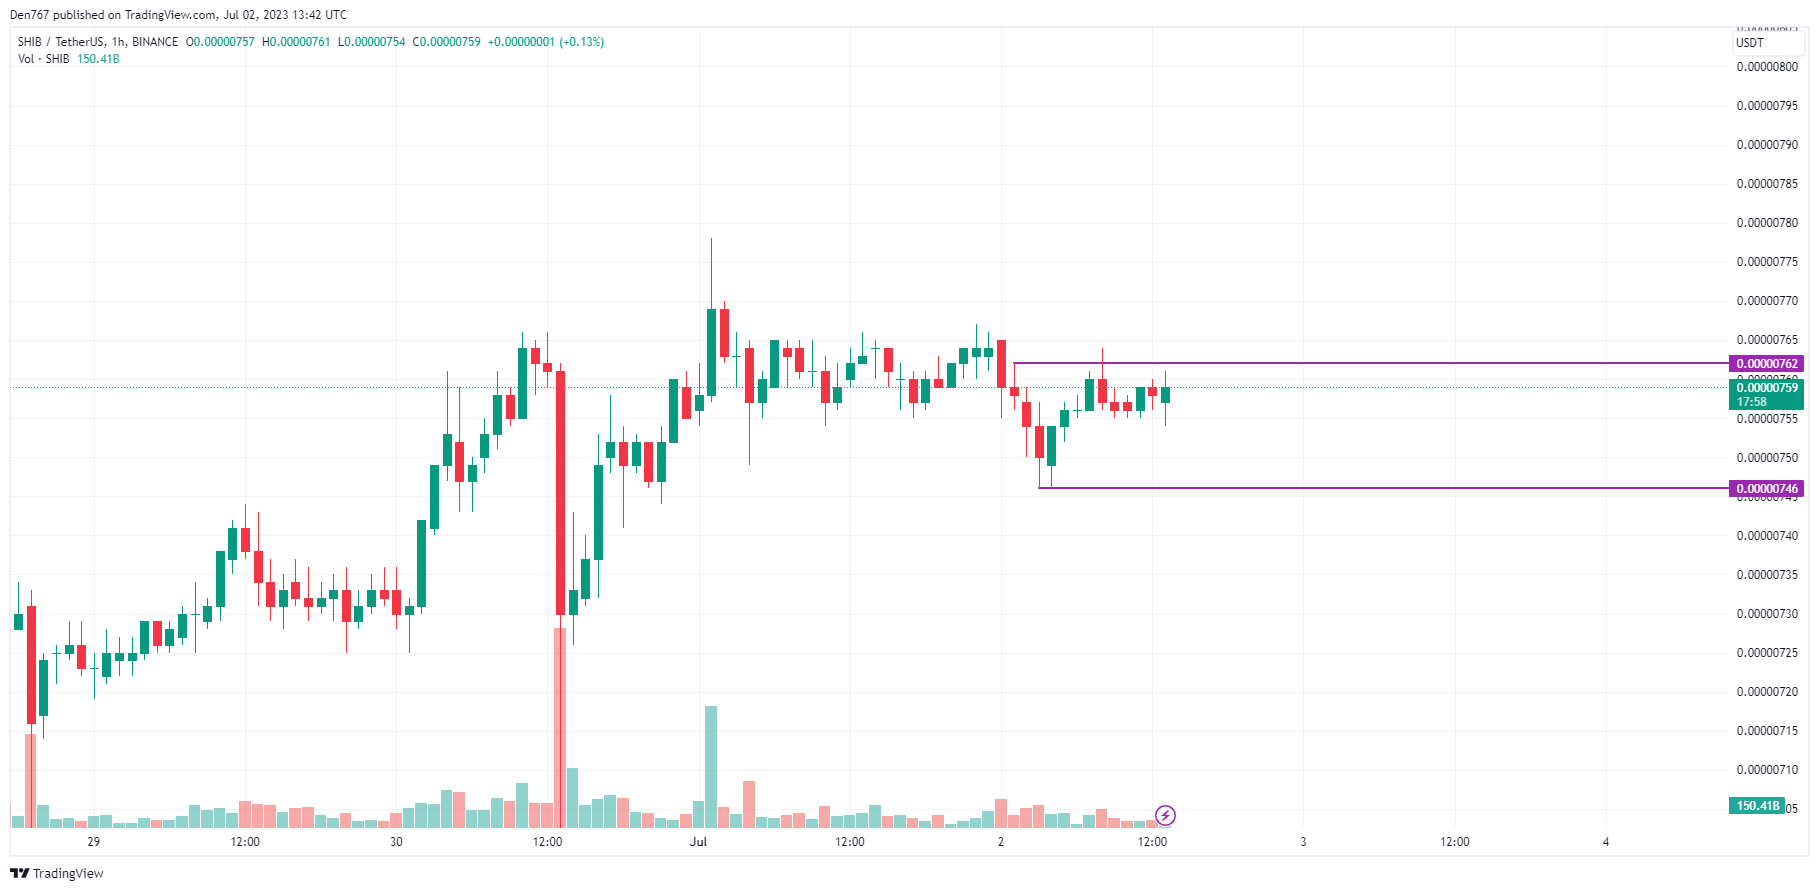
Image by TradingView
On the hourly chart, the rate of SHIB is looking bullish as the price is about to break the resistance at $0.00000762. If bulls manage to do that, the ongoing growth may continue to the $0.00000770 zone.
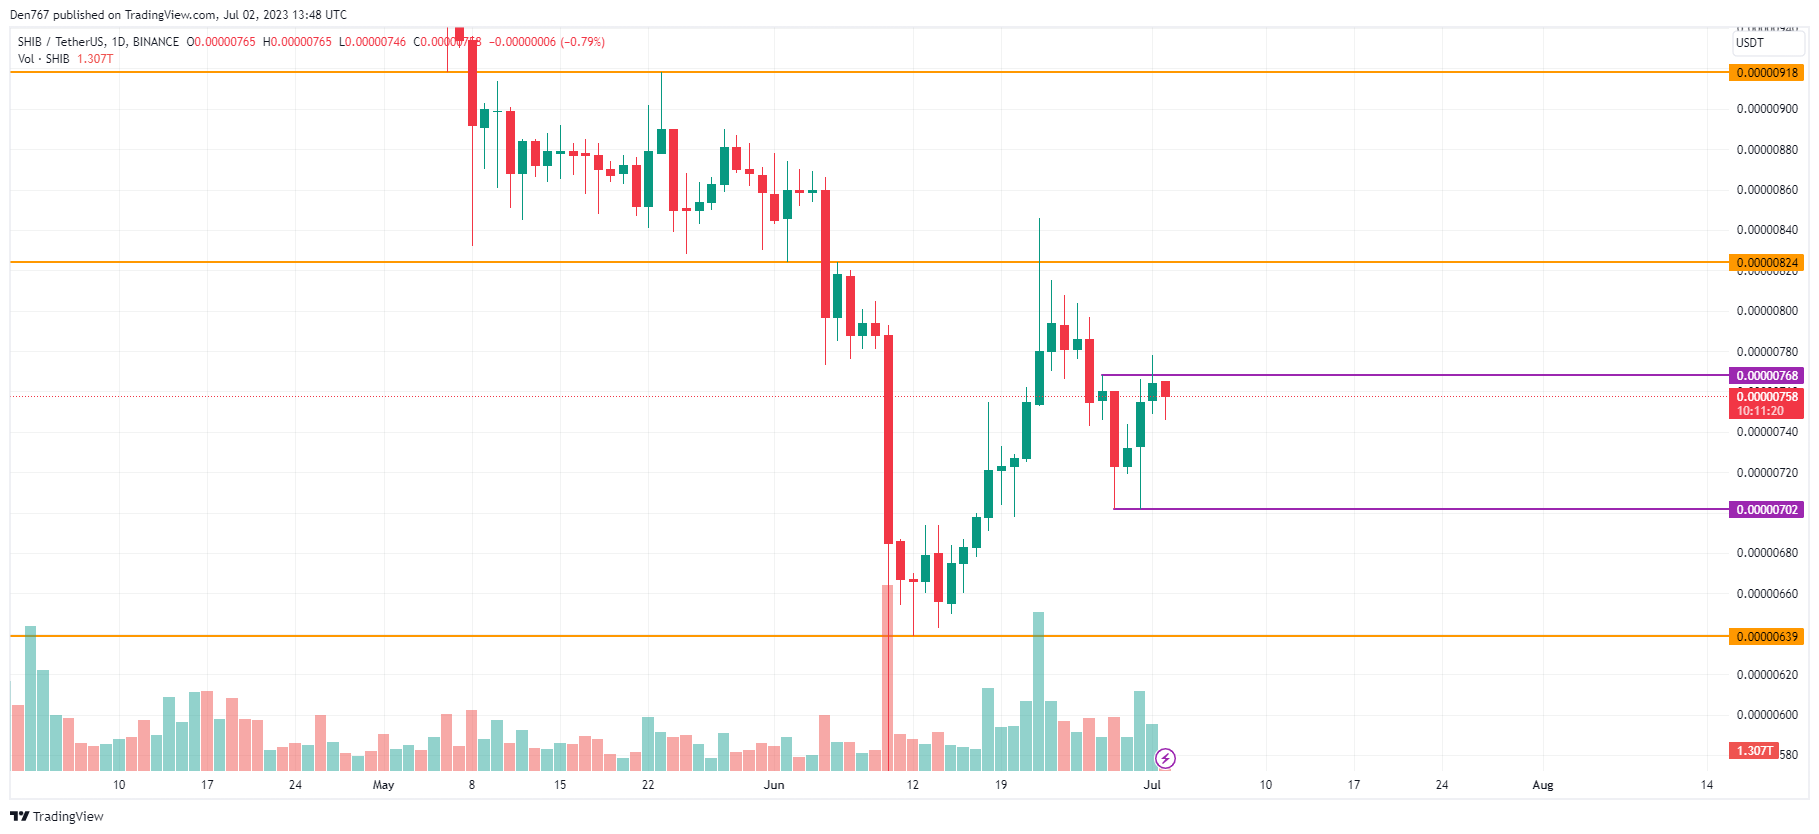
On the daily chart, SHIB is also more bullish than bearish as the rate has not declined much after a false breakout of the $0.00000768 level. If buyers can hold the gained initiative, one may expect a price blast to the $0.000008 range next week.
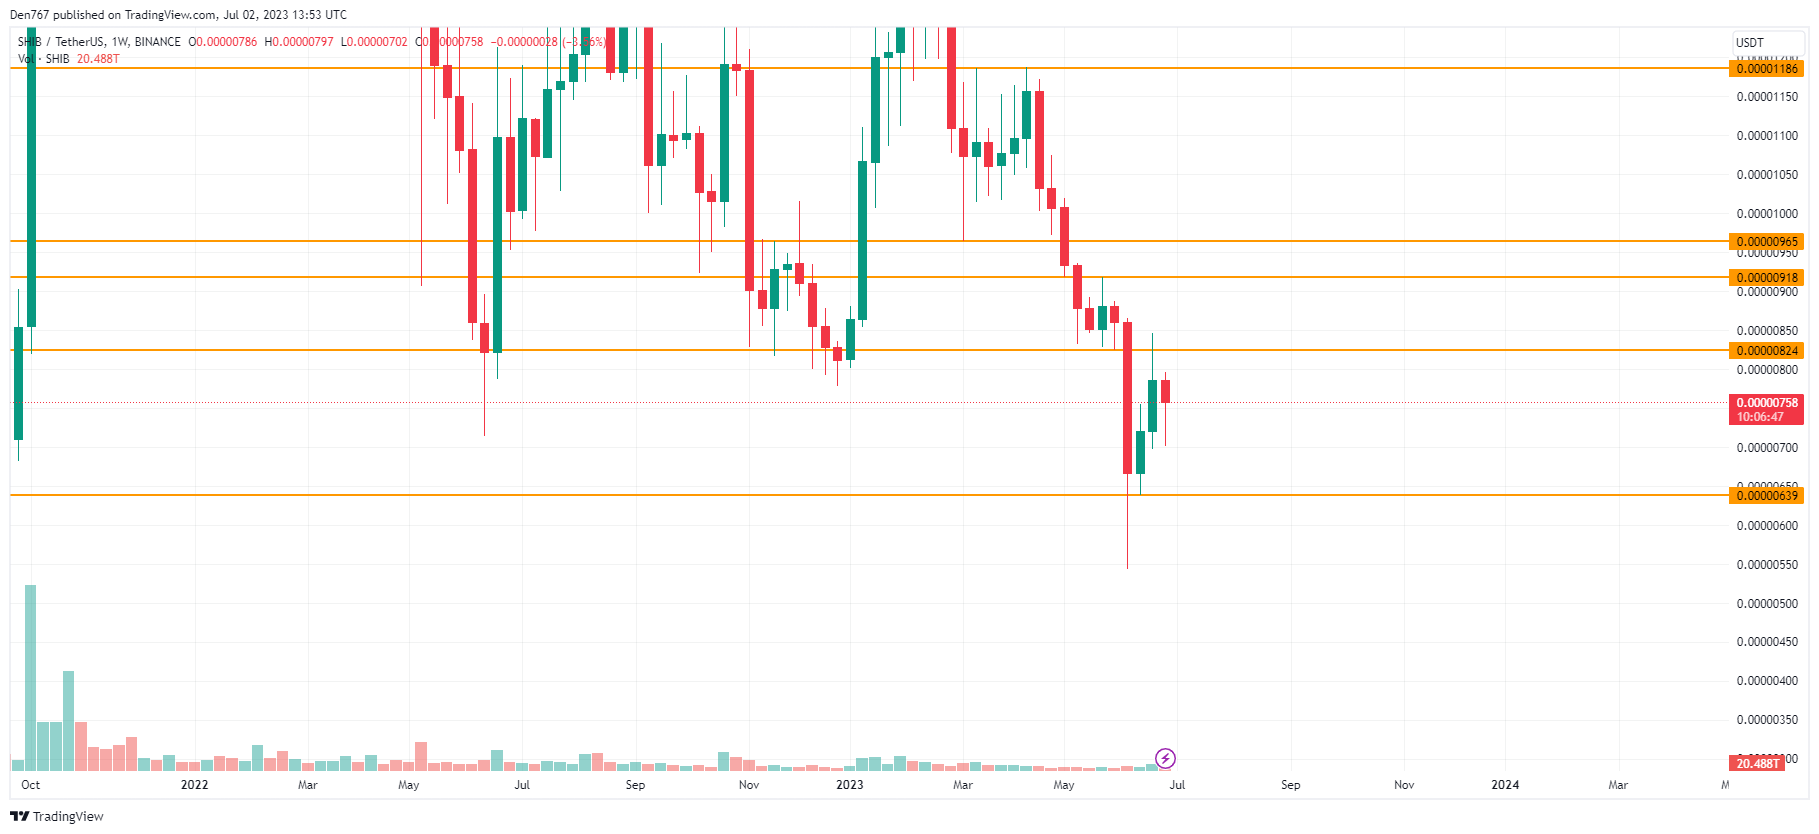
Image by TradingView
On the weekly time frame, the price of SHIB has not accumulated enough energy yet as the rate is far from the key levels. In this case, an important interim mark is $0.000008.
If bulls can reach it, the rise may lead to a resistance breakout followed by a blast to $0.00000850.
SHIB is trading at $0.00000758 at press time.