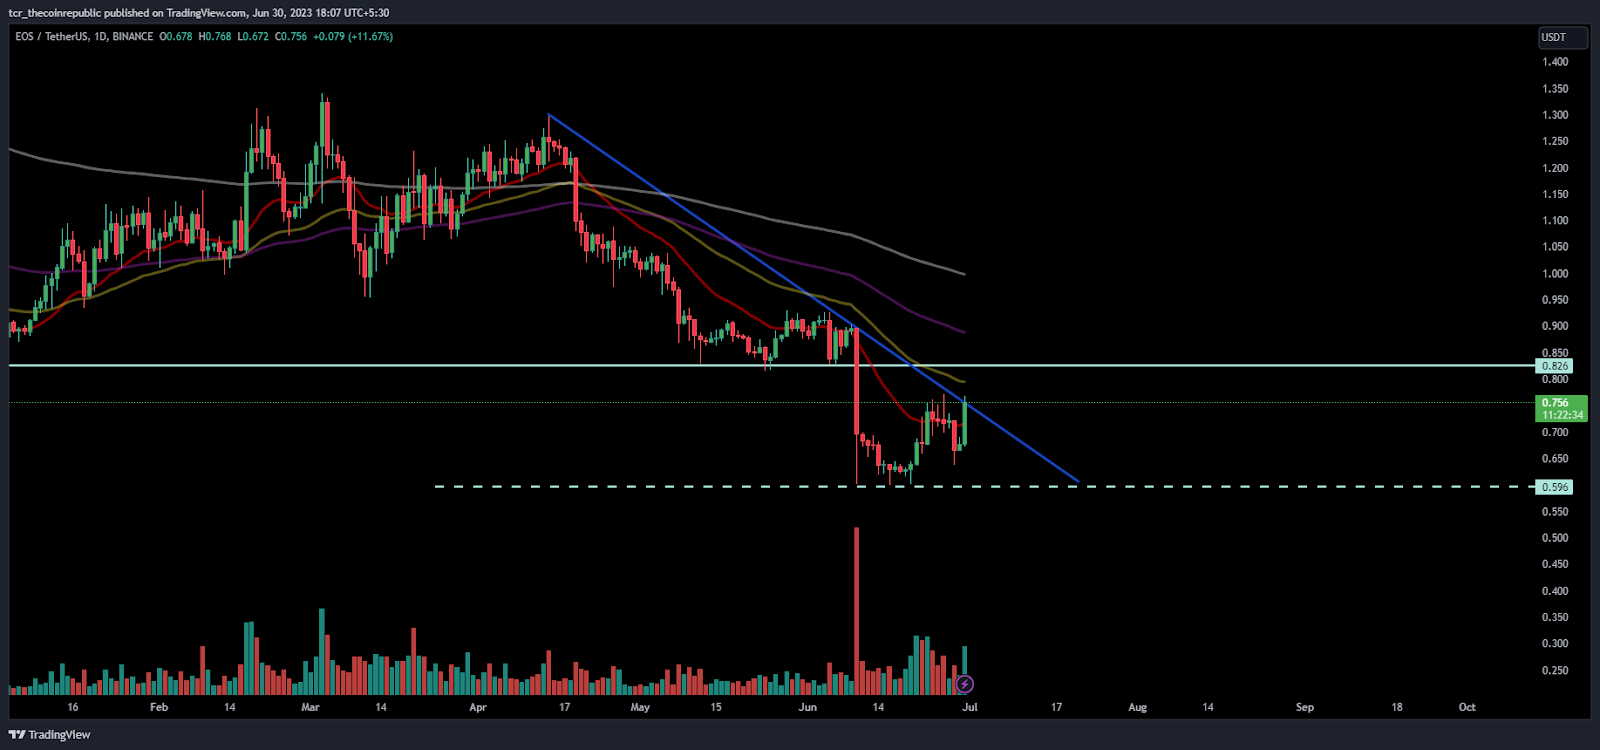
- 1 EOS shows a bullish marubozu candle, gaining by 10% intraday.
- 2 Bulls demonstrated their strength and regained their momentum.
EOS token price rebounded from its demand zone of $0.600 and is escaping above the 20-day EMA near $0.750. In the support range, a double-bottom pattern was noted, and the pattern neckline was broken in the last session, and buyers gained traction above it.
Moreover, the price movement indicates a strong momentum in the token’s trajectory, as it approaches a key level of $0.800, coinciding with the placement of the 50-day EMA mark. However, the sellers were trapped and were covering their positions, resulting in massive bullishness.
The price action shows that the token was in a downtrend, showed a pullback near the substantial support range, and defended the zone near $0.600.
However, the token stayed in a congestion zone, but above the mark of $0.8000, bulls will gain momentum. Similarly, on the downside, a further fall can be anticipated below the mark of $0.550.
At the time of writing, the EOS token price is trading at $0.7559 with an intraday gain of 9.96% showing massive bullishness on the charts. Moreover, the intraday trading volume noted an increase of 27.20% at $263.85 million. Furthermore, the pair of EOS/BTC is at 0.0000243 BTC, and the market cap is $743.70 million.
Daily Charts Shows EOS trying to escape trendline

On the daily charts, EOS token price forms a bullish marubozu candle and is near the trendline, which marks a make-or-break moment for the token. If it faces resistance, then selling will rise again and retest the support range near the 20-day EMA.
Alternatively, in the event that follow-on buying surpasses the trendline above $0.8000, a substantial upward momentum may ensue, propelling the token towards the next significant obstacle at the 100-day EMA level around $0.880.
Short-term Charts Show Bullish Movement

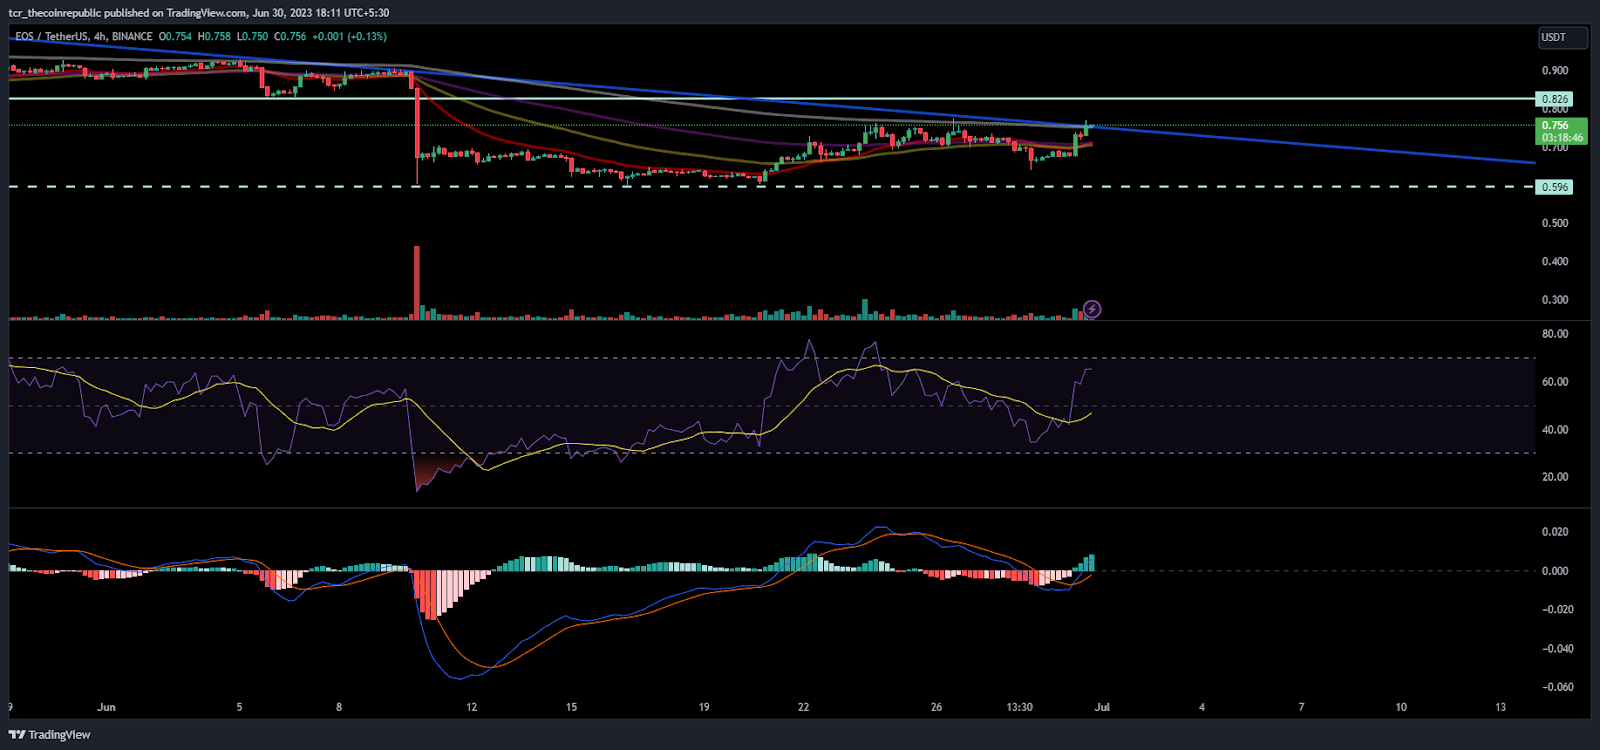
On the 4-hour charts, EOS token showed a massive bullish movement, increasing the gains above the crucial hurdle of $0.7000 and stabilizing above the 20-day EMA. Furthermore, the technical parameters suggest that further buying will be seen in the upcoming sessions.
The Relative strength index (RSI) curve showed a sharp rise, and near 70, it showed a positive divergence which indicates a positive outlook.
The MACD indicator showed a bullish crossover and persisted in forming green bars on the histogram.
Conclusion:
The EOS token price exhibited a bullish chart pattern, maintaining its upward momentum and securing gains above the 20-day EMA mark. This resilience signifies growing strength and a willingness to revisit previous highs in the vicinity of $0.800 during the upcoming trading sessions.
Technical Levels:
Support Levels:$0.7000
Resistance Levels:$0.8500 and $0.900
Disclaimer
The views and opinions stated by the author, or any people named in this article, are for informational purposes only and do not establish financial, investment, or other advice. Investing in or trading crypto assets comes with a risk of financial loss.
 thecoinrepublic.com