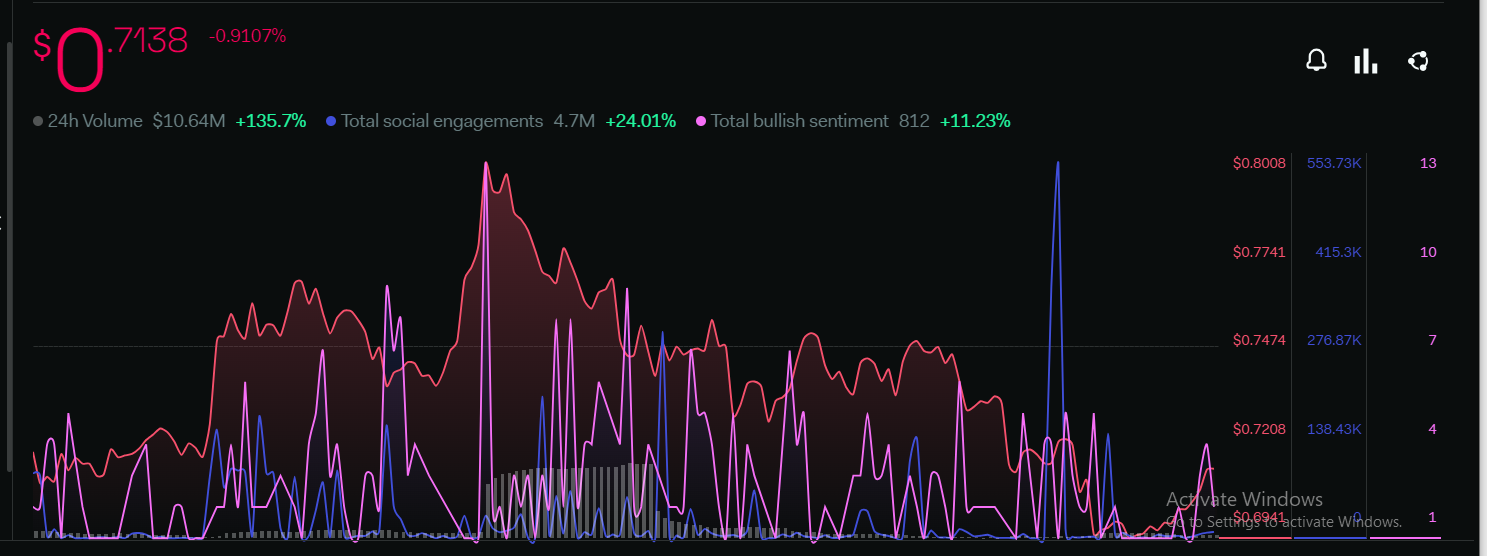
- 1 THETA price is trading at $0.7138; seeing a change of 135.7% in 24-hour trading volume.
- 2 THETA token recorded a 0.91% drop in price in the last 24 hours.
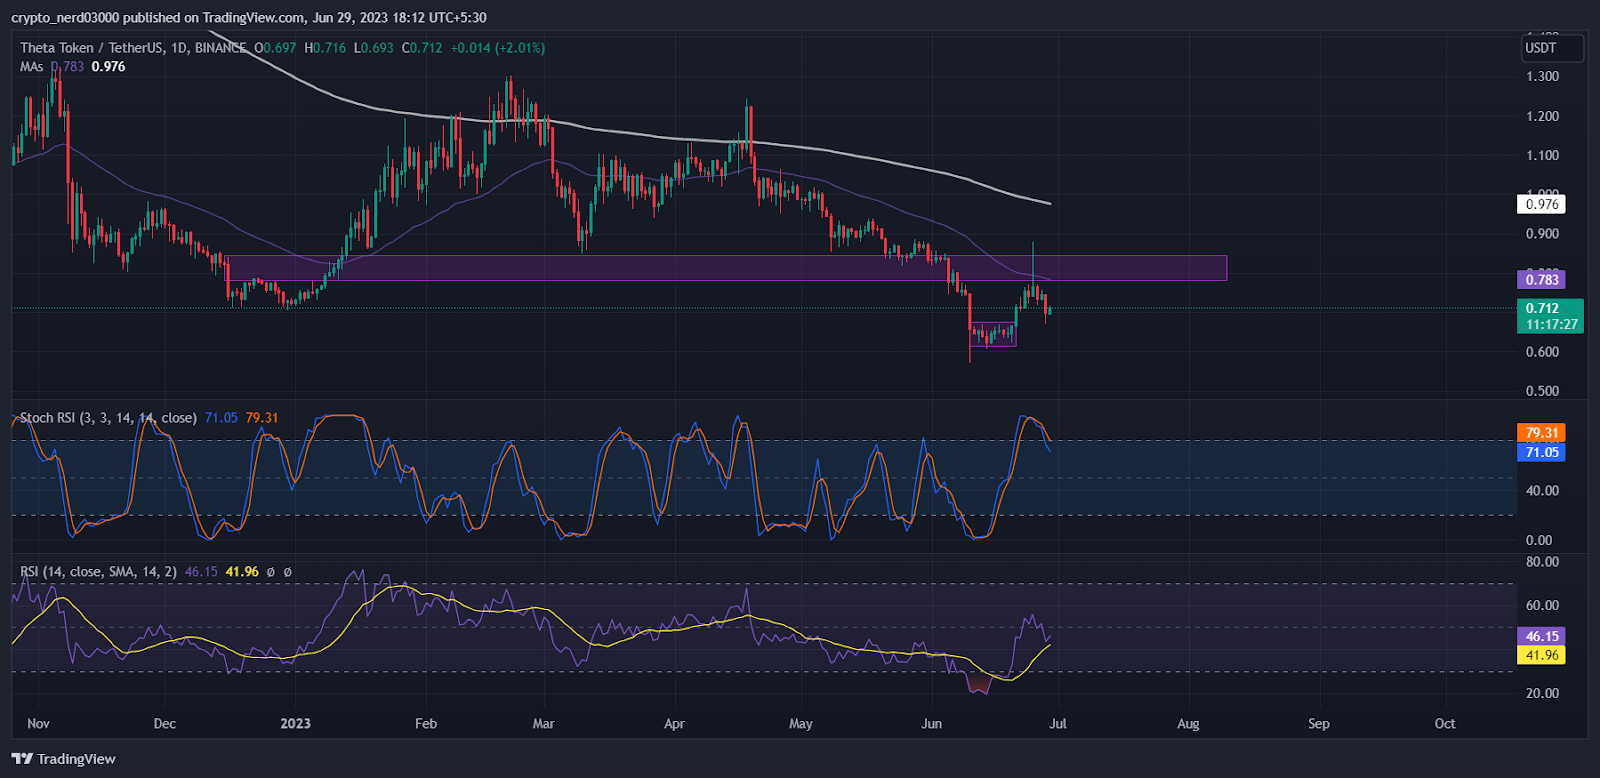
Theta price prediction indicates that THETA token is presently observing a weak surge in its value after breaking above its previous resistance level on the daily chart. The price of the Theta token will require significant buyer support in order to make a recovery. Sellers are dominating the THETA chart. The token is present in the demand zone of the market structure. It has a total supply of 1,000,000,000 with 100% circulating in the market. The coin price is currently 95% below the all time high of $15.9 and can see a recovery soon.Presently, THETA is trading at $0.7138 (press time) with a market cap of $712.19 Million.
THETA Price Observes a Surge In 24h Volume

Investor sentiment regarding THETA price is positive. Total Bearish sentiment metrics are up by 11.23% within the past 7 days. There is a positive surge in the total social engagement level of 24.01% which indicates that the community is more engaged across various social media platforms regarding THETA.
The 24-hour volume level is observing a significant spike of 135.7% which indicates that there is a remarkable increase in the trading activity between the buyers and sellers that may impact Theta price.
Market Sentiment Index

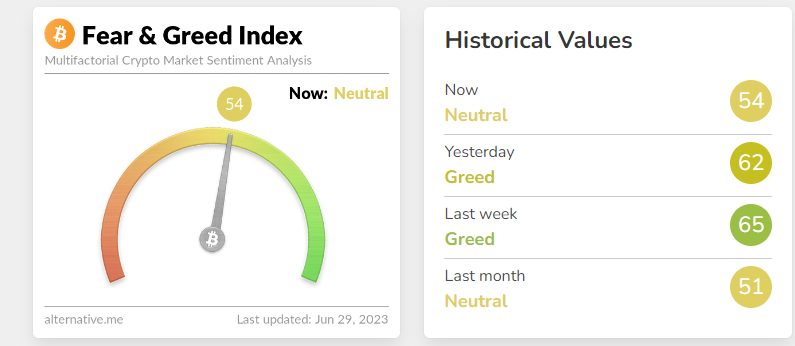
The overall market sentiments have declined sharply within a short period of time. The sentiment index observed a decline of 11 points since last week when the market was trading at around 65 points, as per the greed and fear index provided by the Alternative(dot)me platform.
Theta Price Prediction: Technical Analysis of THETA Price

The RSI line is moving around 46.15, while the 14 SMA is around point 41.96 points below the median line. The RSI line is predicted to see an increase in its value if it breaches the 50 mark though a bearish fall is more probable.
In stochastic RSI, the %K line is moving towards oversold levels. The current value of stochastic RSI is 71.05 points.
Conclusion
The majority of technical indicators favor the bears on the daily timeframe. The EMA and MA levels are providing severe resistance to the price and oscillators are trading near their immediate resistance levels.
Technical levels –
Support -$0.600
Resistance – $1.000
Disclaimer
The views and opinions stated by the author, or any people named in this article, are for informational purposes only, and they do not establish financial, investment, or other advice. Investing in or trading crypto assets comes with a risk of financial loss.
 thecoinrepublic.com
