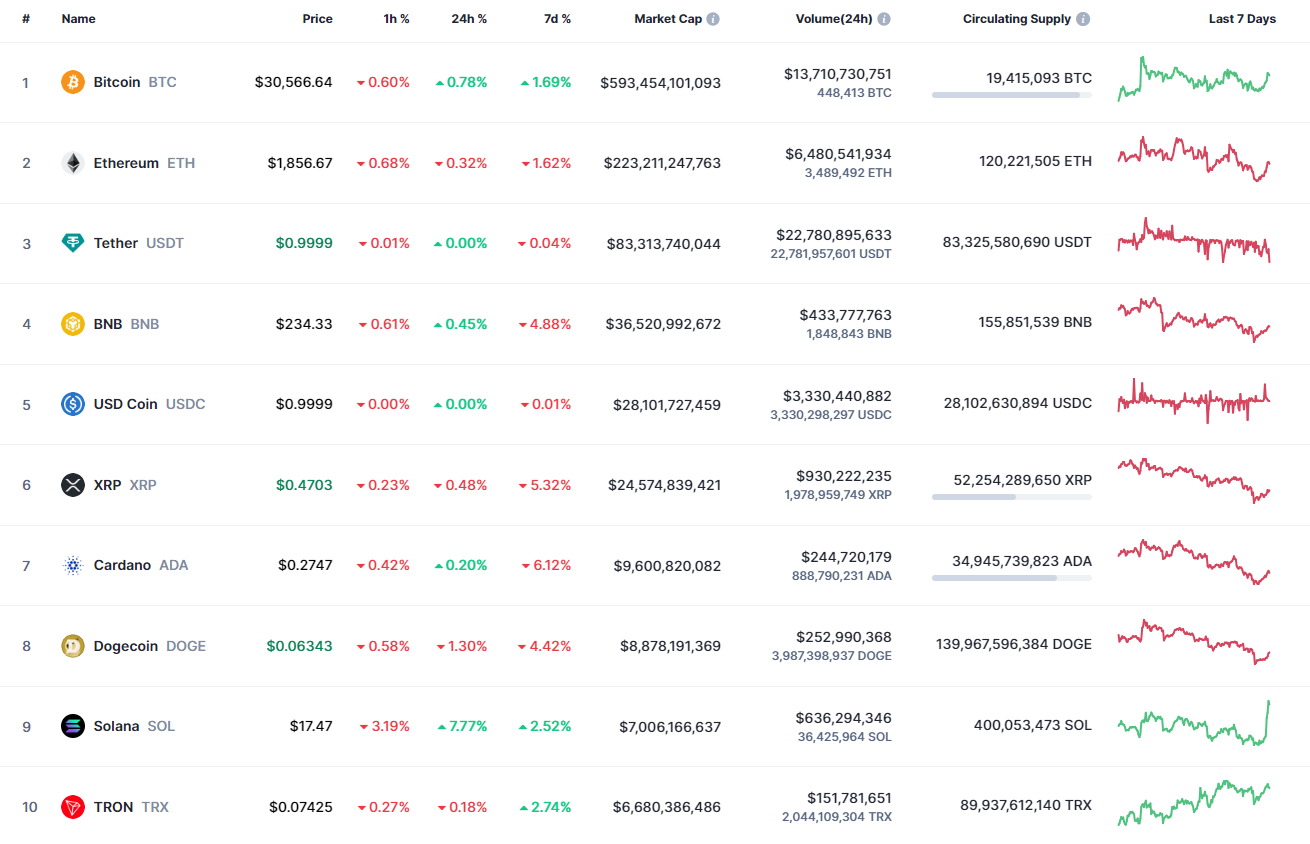
The cryptocurrency market seems not to have decided which way to move as the rates of some coins are rising while others have come back to the red zone.

Top coins by CoinMarketCap
BCH/USD
The rate of Bitcoin Cash (BCH) keeps rising, going up by 4% over the last 24 hours.

Image by TradingView
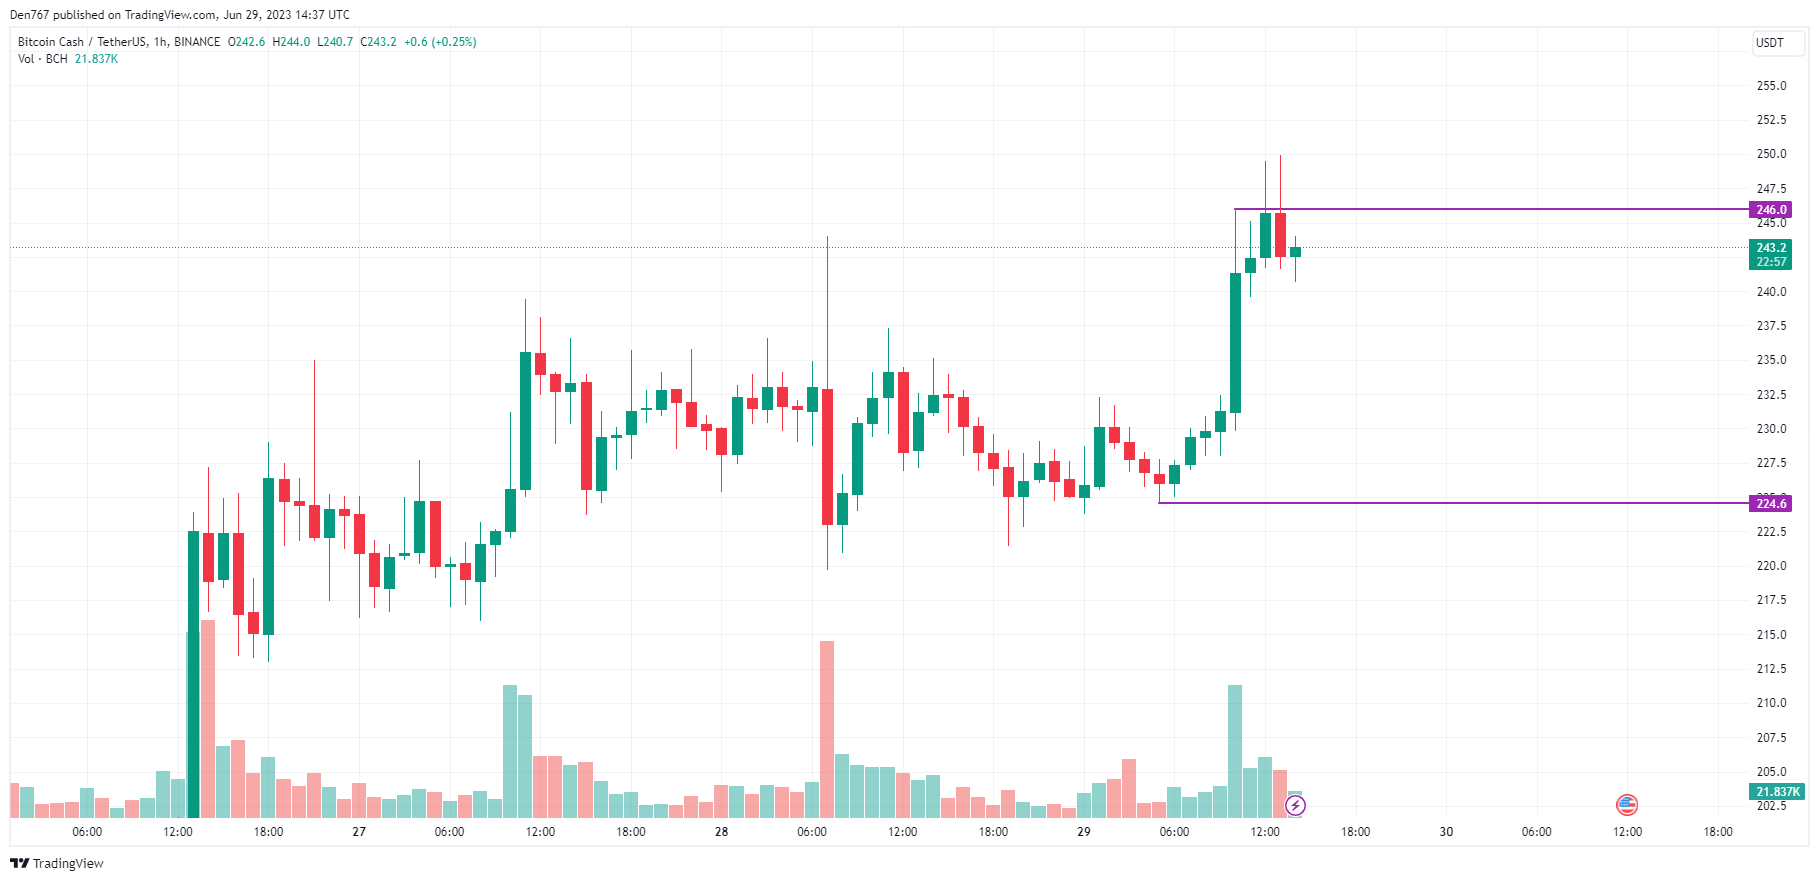
On the hourly chart, the price of Bitcoin Cash (BCH) is trading near the local resistance level of $246. The volume has started to fall, which means that bears might locally seize the initiative.
However, if the candle closes near the mentioned mark, the upward move is likely to continue to the $250 zone and above.

Image by TradingView
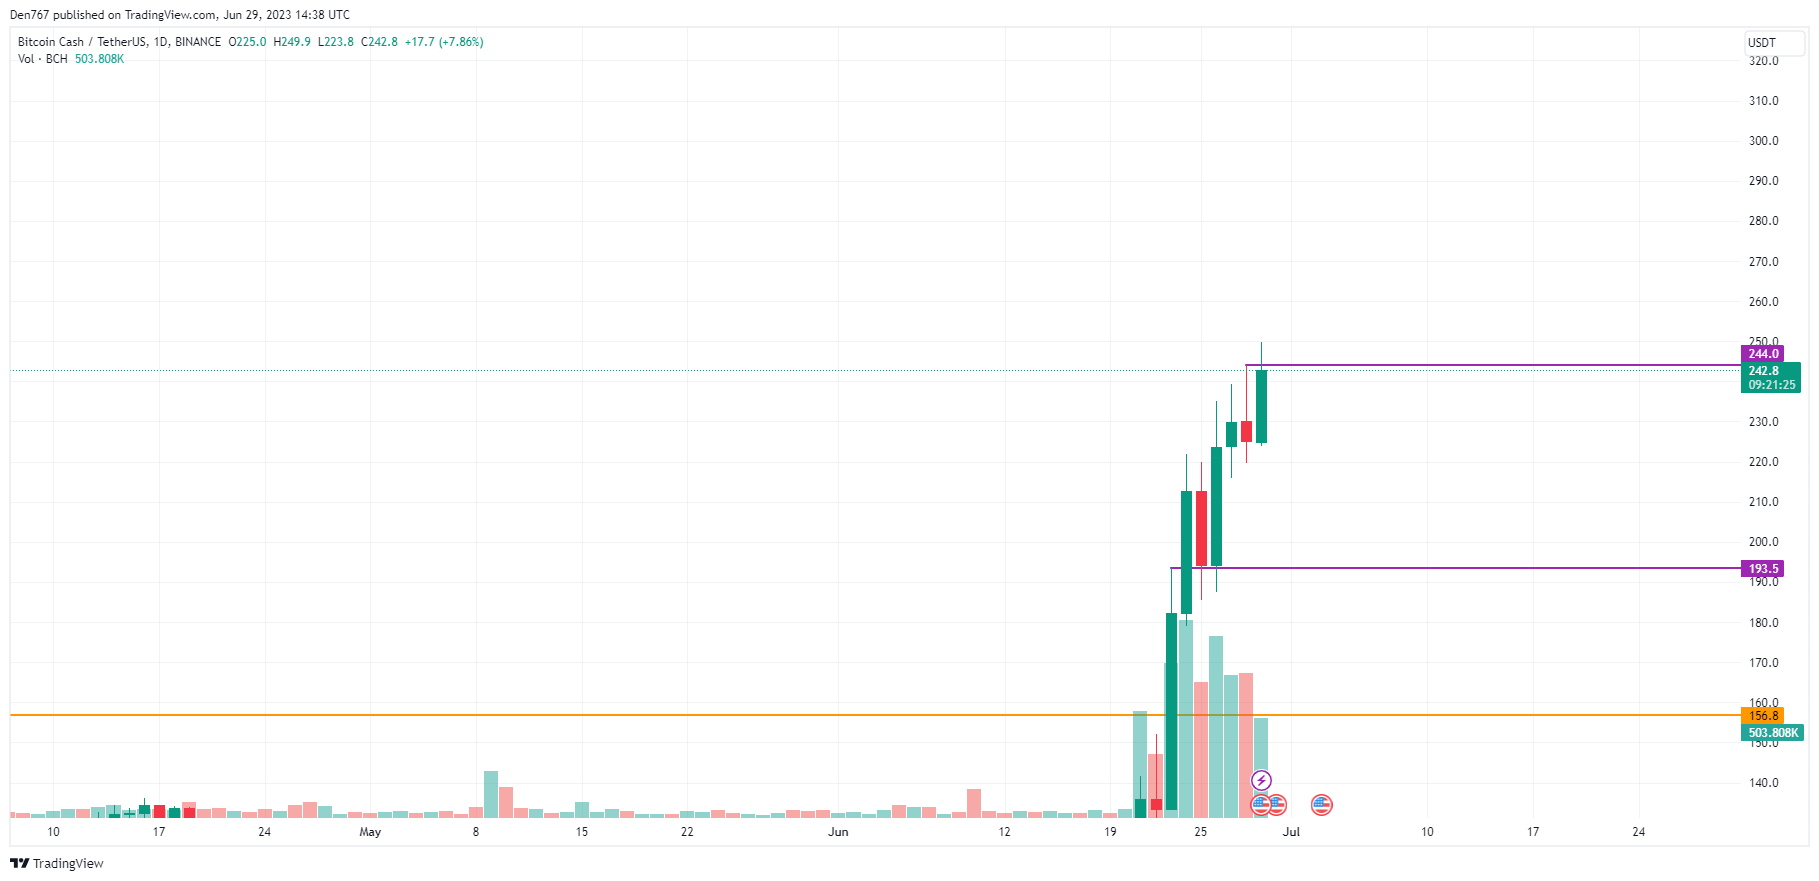
On the bigger time frame, one should pay attention to the bar closure in terms of yesterday's peak at $244. Currently, the price has made a false breakout of it; however, if the candle closes with no lock wicks, growth may lead to the test of the $260-$280 area by the end of the week.

Image by TradingView
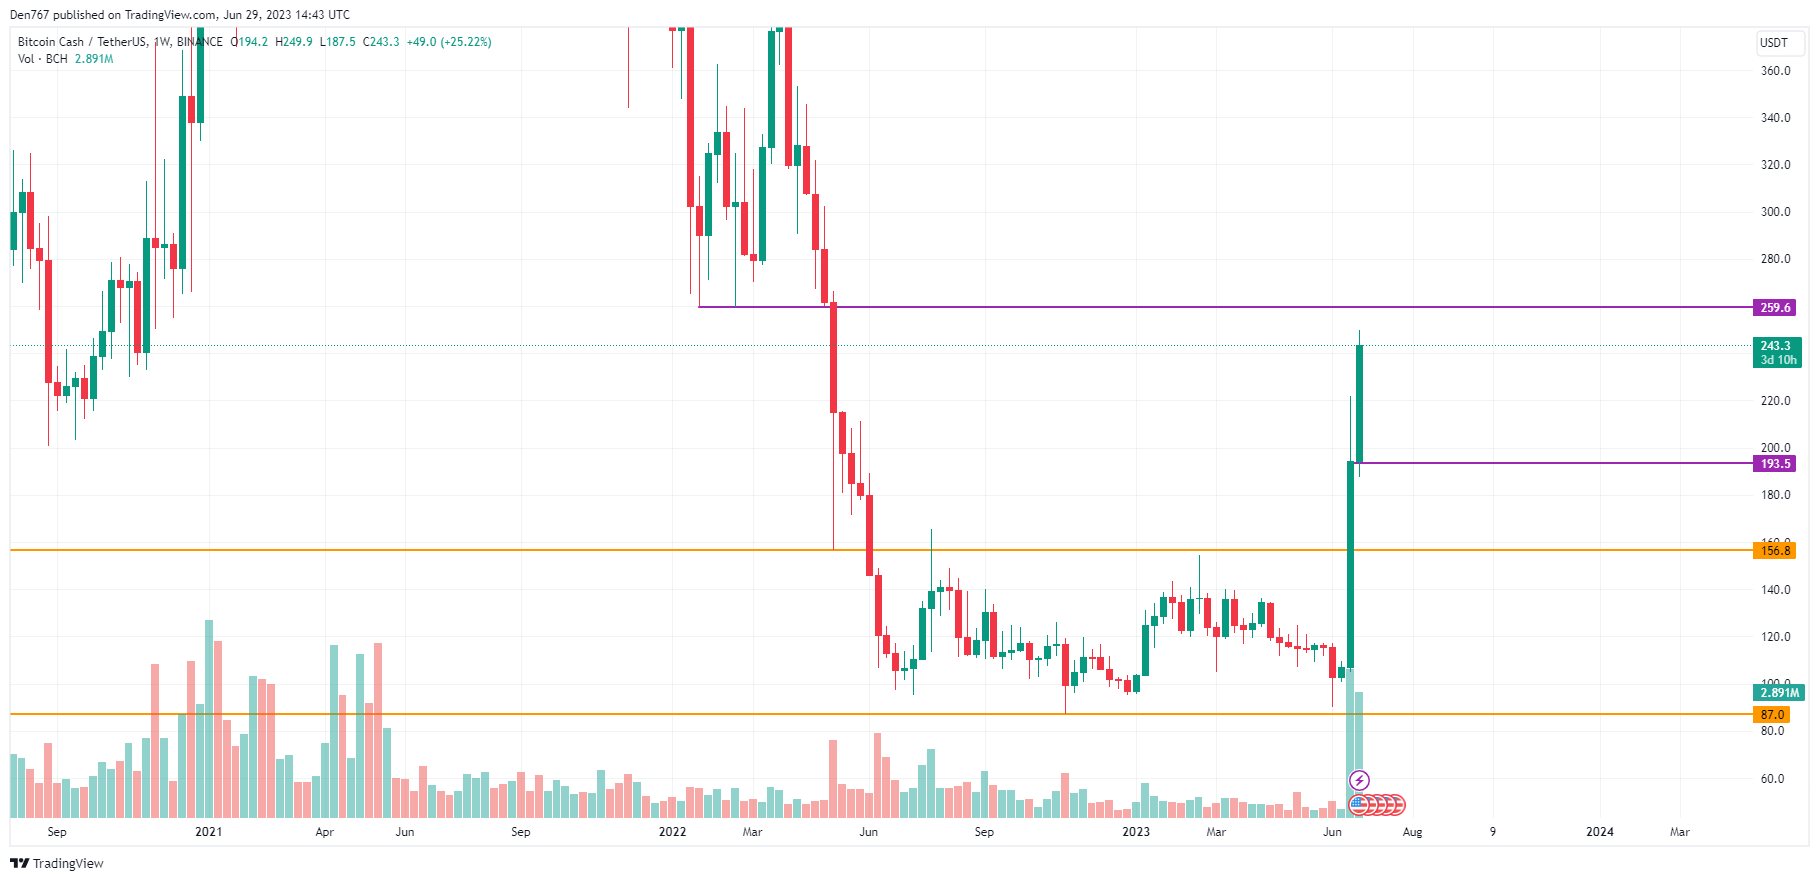
From the midterm point of view, the resistance at $259.6 that serves a mirror level plays a key role for traders. As the rate has sharply risen since the beginning of the month, there is a chance to see a bounce back from the zone around $260. Such a scenario is relevant until mid-July.
Bitcoin Cash is trading at $243.3 at press time.
 u.today