- 1 XDC is currently trading at $0.0324, seeing a fall of 19.07% in the 24-hour trading volume.
- 2 The XDC price recorded a gain of 0.04% in the last 7 days.
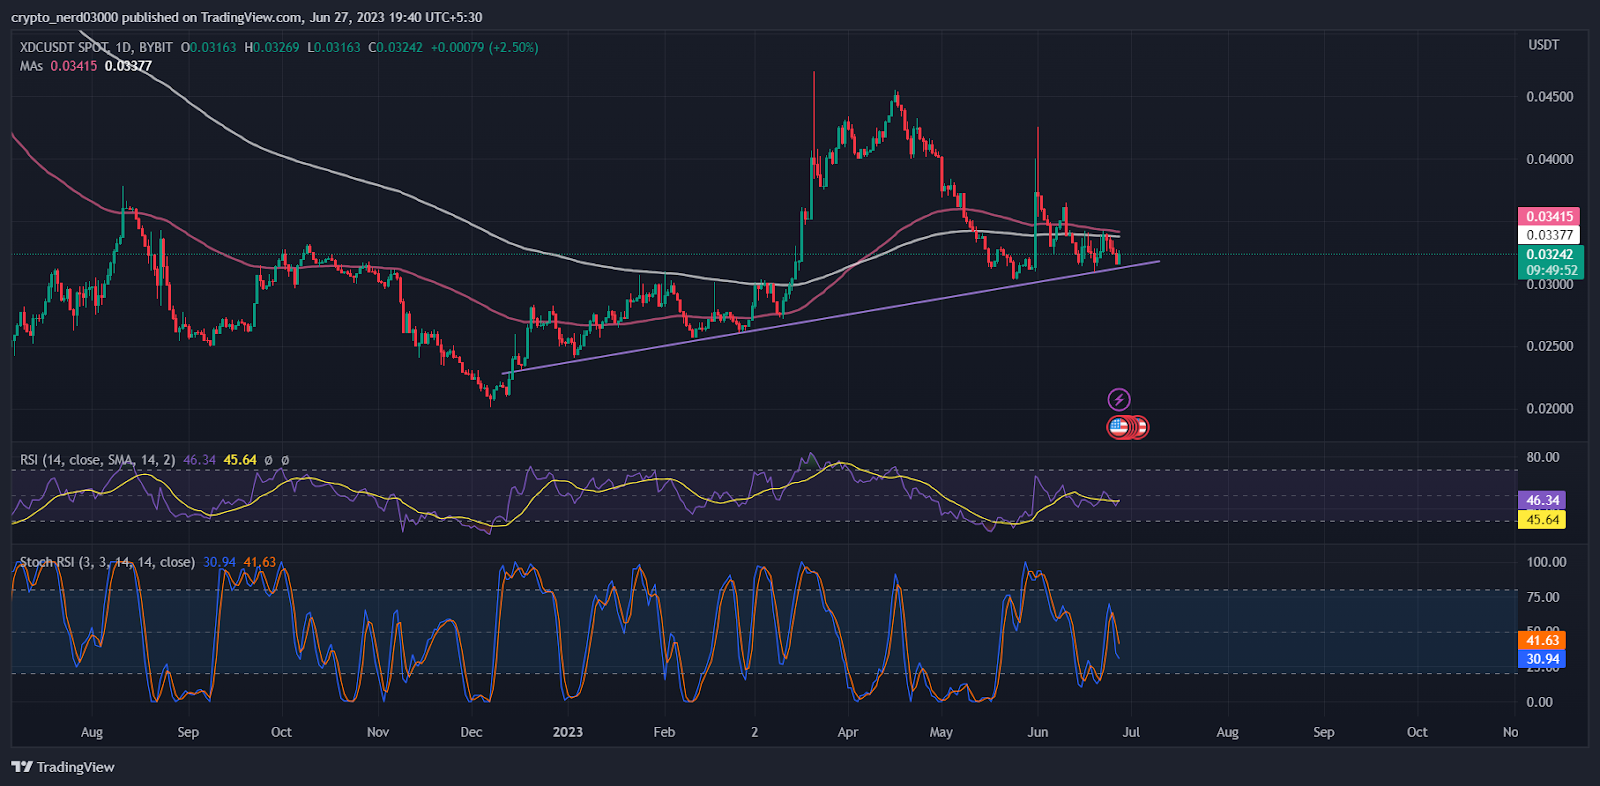
XDC price prediction suggests the XDC network price is attempting to make a recovery. The XDC price is presently moving near the demand zone. The investors are projecting a little hesitancy regarding the further growth of the XDC coin according to the price action.
The XDC price action indicates that the bulls are attempting to take control of the market back from the bears. XDC Network price is developing a green candle near the demand zone on the daily time frame. XDC token price has started making a bull trend though it’s yet to break above the 100 and 200 EMA levels which may prove to be challenging. The price action indicates that despite the obstacles, the bulls will persist and may prevail over the bears.
XDC, formerly known as XinFin Network, is a hybrid blockchain platform that combines the transparency of public blockchains with the speed and security of private networks. The project intended to provide streamlined financial services to its users. XinFin Network was founded in 2017 and is based in Singapore.
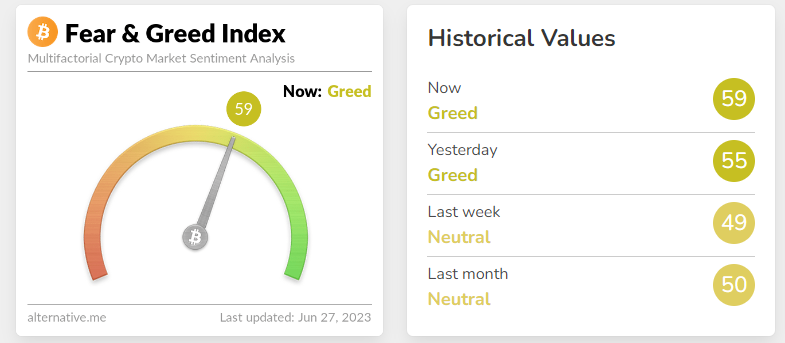
Sentiment Index Returns To Neutral Level

Investor sentiments regarding the overall market are taking a slight decline from its recent high. The sentiment metric of the market is seeing a slight appreciation of 6 points within a short period of time. The greed and fear index is at 59 points according to the Alternative(dot)me platform.
Technical Analysis of XDC Price

As the RSI line indicates that the XDC price makes a bullish move as it is taking a reversal from the median line. The current value of the RSI is 46.14 points. The value of 14 SMA is 35.64 points providing support to the RSI line.
The stochastic RSI is steadily moving toward the oversold level. At present, the value of the stochastic RSI is 30.94 points.
Conclusion
According to the analysis, the XDC network price is attempting to make a recovery. XDC Network price is making a green candle near the demand zone on the daily timeframe. If it gains buyers from the current level, it can make a recovery of 30 to 40% of its value.
Technical Levels:
Support –$0.03000
Resistance – $0.04000
Disclaimer:
The views and opinions stated by the author, or any people named in this article, are for informational purposes only, and they do not establish financial, investment, or other advice. Investing in or trading crypto assets comes with a risk of financial loss.
 thecoinrepublic.com
