- 1 THORchain price is currently trading at $0.981 while witnessing a loss of 2.49% during the intraday session.
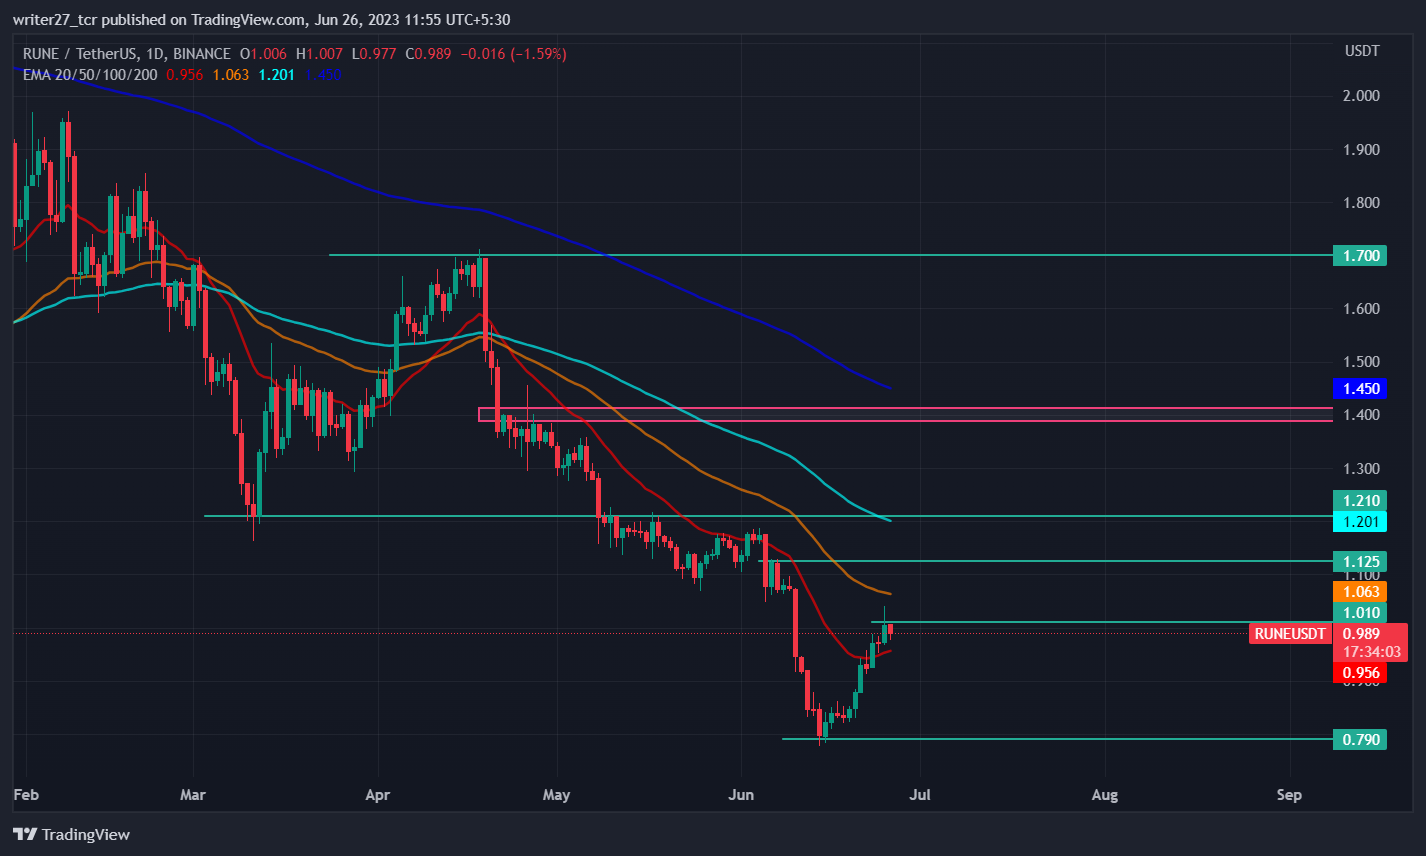
- 2 Rune price has positively crossed above the 20-day EMA.
- 3 The year-to-date change in Rune is -22.37%.
Rune price has been in a bearish trend since the start of February after reaching the annual high at $1.972. In March, the cryptocurrency price formed a support level at $1.21 and initiated a bullish rally to retest the annual high. The move was stalled at $1.70 due to the presence of bears in the market.
This triggered a drop in the price and it gained enough bearish momentum to wreck the support level of $1.21, after which the price entered into a wide consolidation zone ranging between $1.07 and $1.21, and even this was not sustainable. During the start of June, Rune price shattered the support of $1.07.
Recently, THORchain price formed a support level at $0.79 and initiated a bullish rally as major cryptocurrencies began to recover. Consequently, altcoins gained momentum and demonstrated notable gains in their weekly chart, indicating growth potential.

Currently, the price is facing resistance from the $1.01 level, and it seems like bears do not want the price to rise above $1. The previous candle closed at $1.005 and the current candle has turned bearish. If the current candle breaks the low of the previous candle, there is a possibility that the price might experience a short-term pullback toward $0.90. For the price to retest the annual high, it needs to rise above $1.70. There is a clean move for the price above the $1.40 level.
On the other hand, If the price can break and close above $1, there is a high possibility for the price to head toward the $1.125 level. The weekly gain of Rune is 18.87% and market capitalization is down by 1.56% to $327 million. The 24-hour volume is up by 82.20%.
Will Rune Price Rise Above $1?

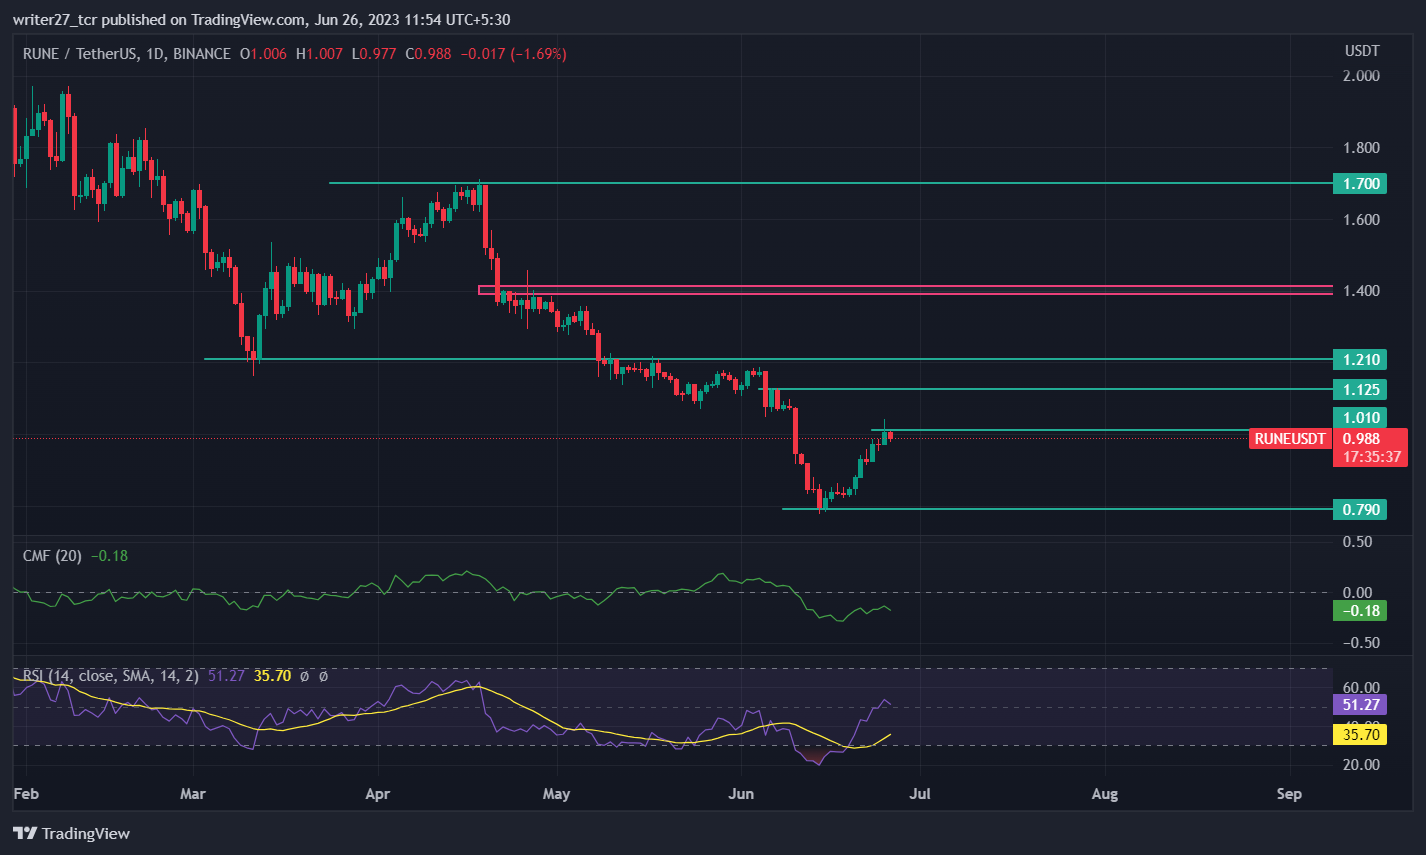
THORchain price has crossed above the 20-day EMA, indicating bullish momentum in the price. The Chaikin money flow (CMF) score is -0.18, indicating weakness in the market. However, the CMF did increase from -0.23. The Relative strength index (RSI) is at 50.60 which denotes that price is in neutral territory. However,t the RSI is sloping upwards which indicates high pressure from the buying side.
RSI reached the oversold zone which initiated a reversal in the price. The long/short ratio is 0.74 with 42.61% longs and 57.39% shorts, denoting rising pressure from sellers in the market.
Conclusion
The overall market structure and price action of THORchain is currently bullish but the price is struggling to rise above $1. The technical parameters are favoring the selling side as of now, indicating selling pressure in the current candle. If the current candle can break the low of the previous candle, there is a chance of pullback toward $0.90. The market leaders, Bitcoin and Ethereum, have shown a tremendous recovery which has turned altcoins bullish.
Technical levels
Major support: $0.79 and $0.60
Major resistance: $1.125 and $1.21
Disclaimer
The views and opinions stated by the author, or any people named in this article, are for informational purposes only. They do not establish financial, investment, or other advice. Investing in or trading crypto assets comes with a risk of financial loss.
 thecoinrepublic.com
