Bitcoin Cash (BCH) reached a new yearly high after a 145% increase in two weeks. Kava. (KAVA) rallied during the weekend but failed to clear a crucial horizontal resistance. Near Foundation (NEAR) did not increase that much during the weekend but began a strong rally today.
The crypto market had a bullish performance last week. However, a short-term bearish reversal began near the end of the week and continued during the weekend.
Despite this temporary slump, these three cryptocurrencies had positive performances, being labeled as the weekend’s crypto gainers.
Bitcoin Cash (BCH) Yearly High Leads Crypto Weekend Gainers
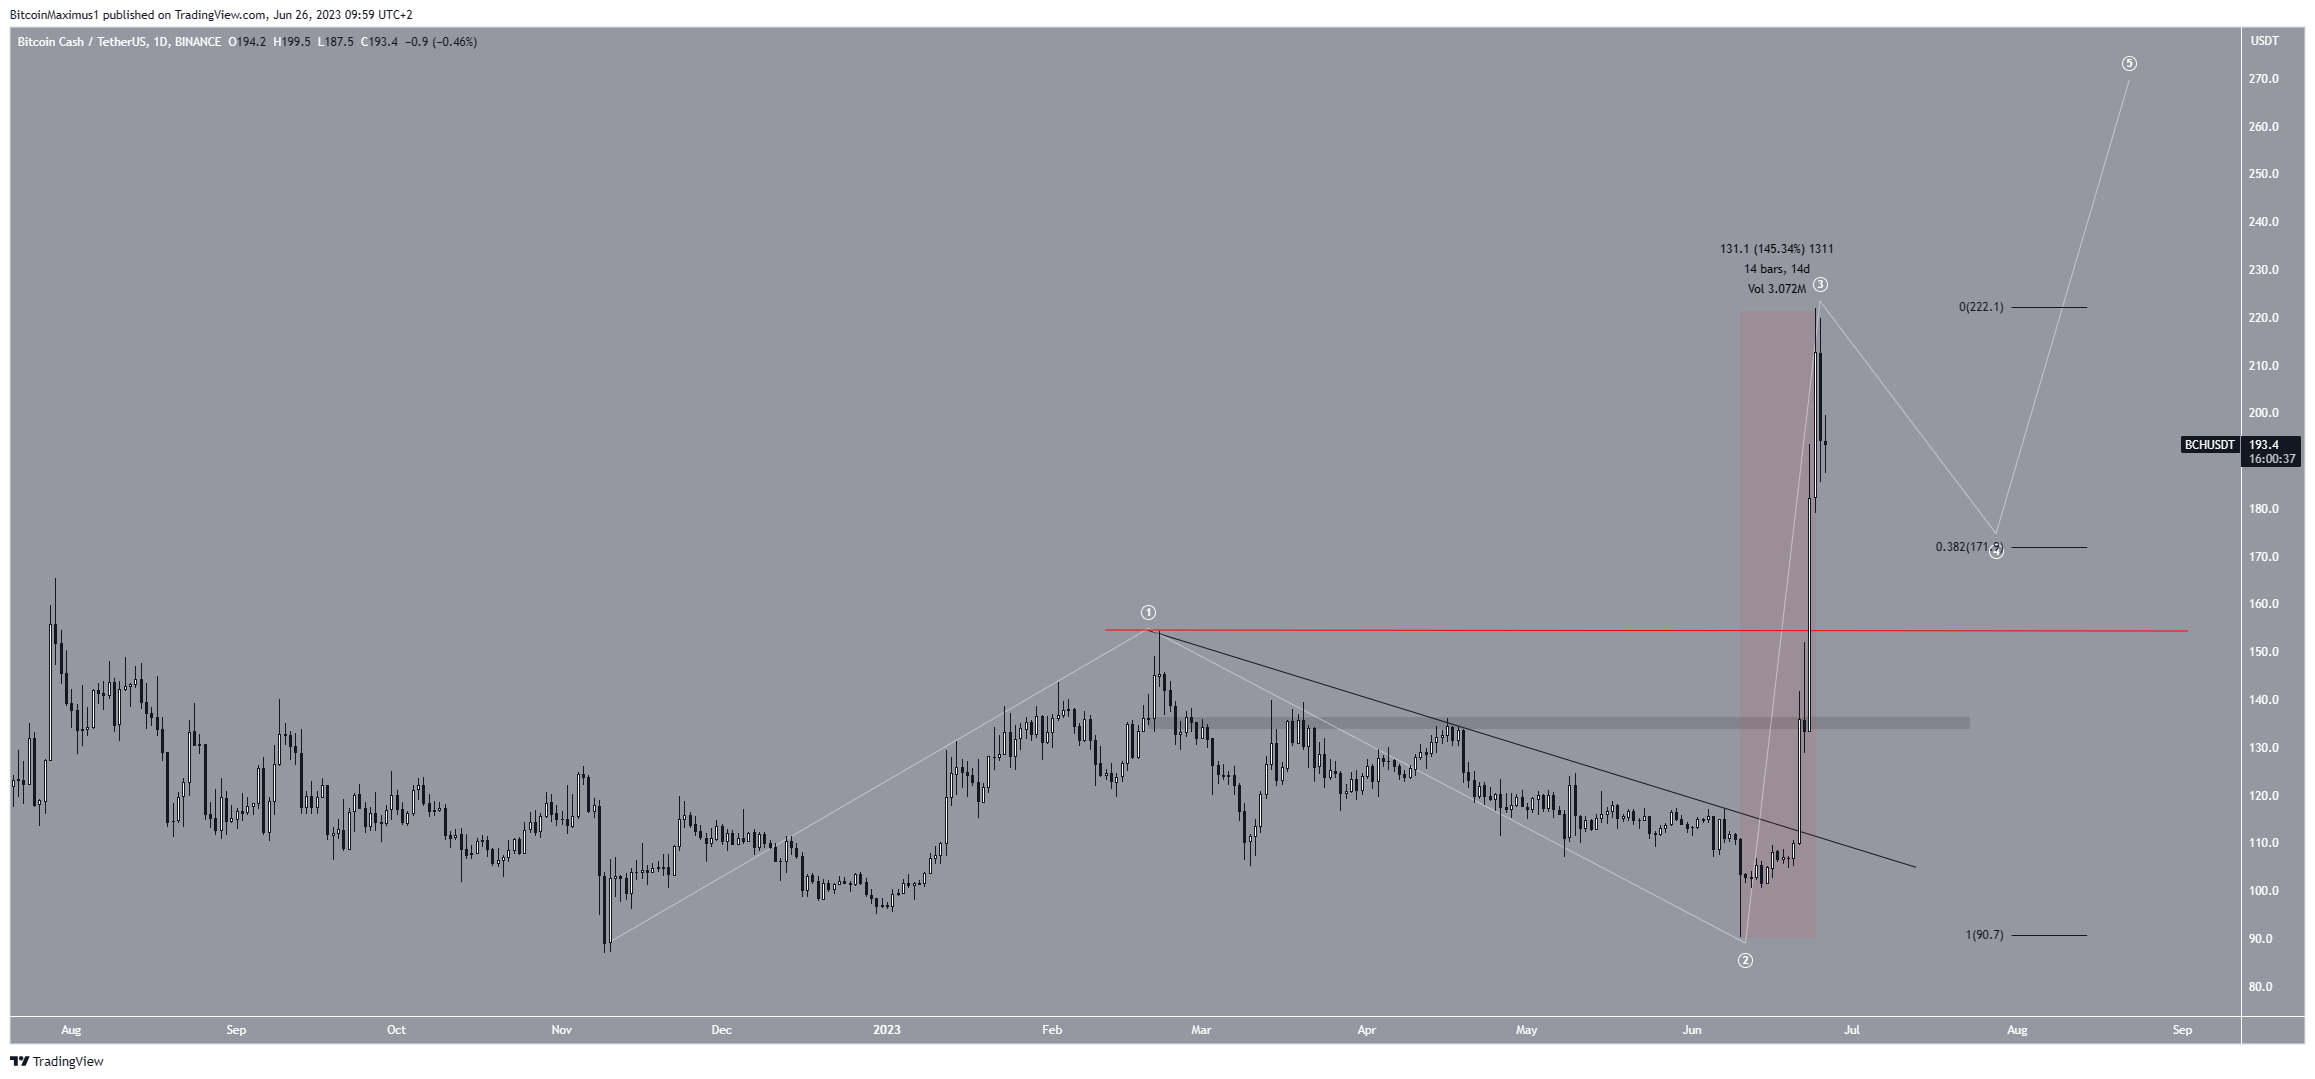
The BCH price has been on an absolute tear since June 10. The price reached a new yearly high of $222 on June 24. This was the culmination of a two-week rally in which the price increased by 145%.
BCH moved above the $135 resistance area during the increase and broke out from a diagonal resistance line. These are both signs that the correction is complete. Now, the $135 area is expected to provide support.
Due to the steepness of the increase, the movement is likely part of wave three in a five-wave increase. Technical analysts utilize the Elliott Wave theory to ascertain the trend’s direction by studying recurring long-term price patterns and investor psychology.
If this is correct, the BCH price can fall to the 0.382 Fib retracement support level at $172 before resuming its ascent. After the short-term slump is over, an increase to $270 could follow.

Despite this bullish BCH price prediction, a drop below the wave one high (red line) at $155 will mean that the trend is still bearish. A drop to the next support at $110 will be expected in that case.
Read More: 9 Best Crypto Demo Accounts For Trading
Kava (KAVA) Price Reaches Resistance of Bullish Pattern
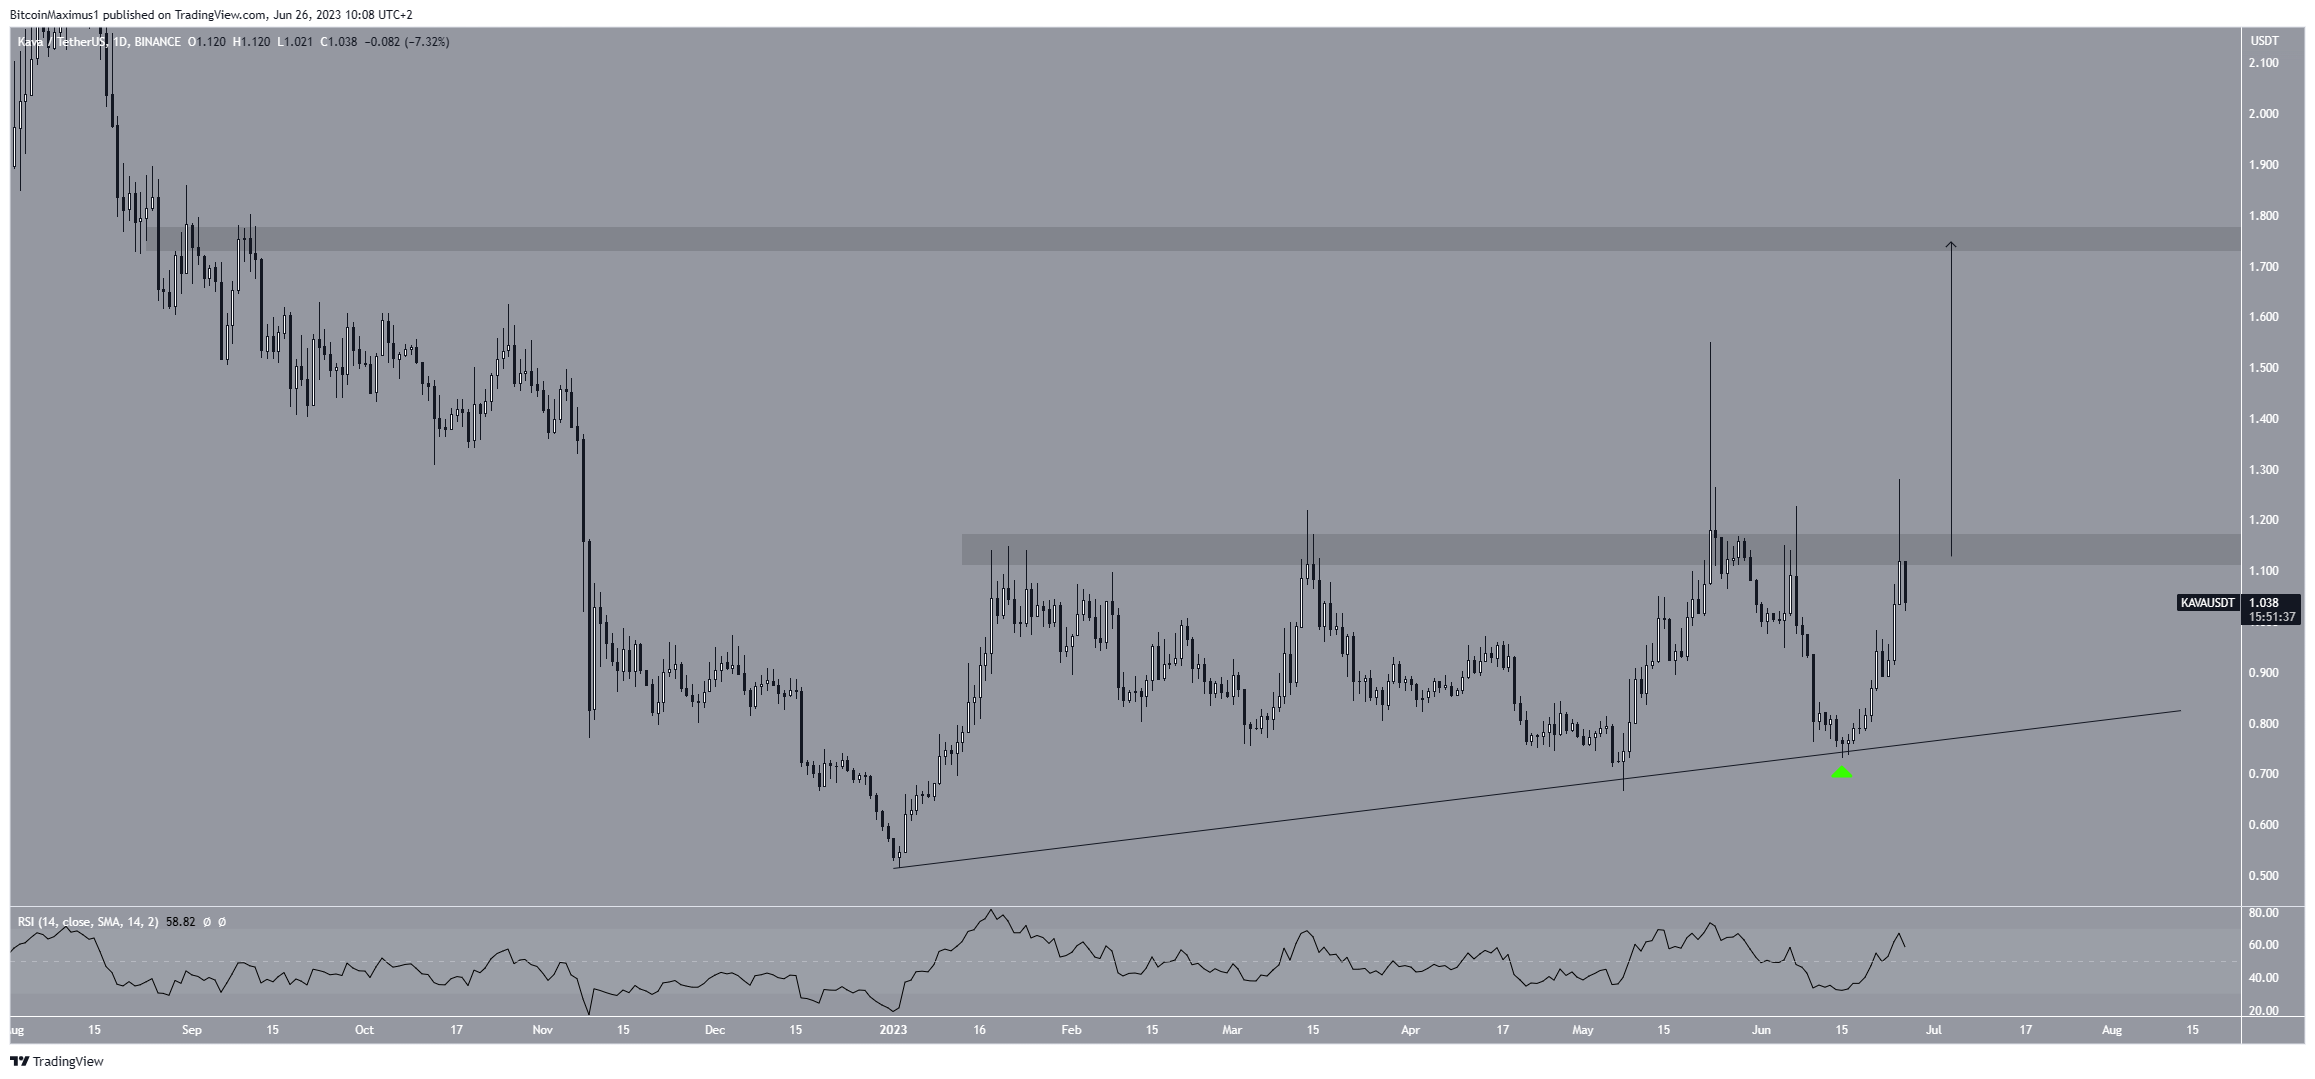
The KAVA price has increased alongside an ascending support line since the beginning of the year. More recently, it bounced at the line on June 15 and began a sharp rally.
While KAVA reached a high of $1.28 on June 25, it failed to close above the $1.15 horizontal resistance area. Rather, it created a long upper wick (red icon) and fell. These wicks are considered signs of selling pressure since buyers could not sustain the price increase.
Despite the drop, the $115 area and the ascending support line together create an ascending triangle. This is considered a bullish pattern. So, a breakout from it is the most likely scenario.
The daily RSI also supports the continuing increase. By using the RSI as a momentum indicator, traders can determine whether a market is overbought or oversold and decide whether to accumulate or sell an asset. Bulls have an advantage if the RSI reading is above 50 and the trend is upward, but if the reading is below 50, the opposite is true. The indicator is above 50 and increasing, indicating a bullish trend.

Despite this bullish outlook, another rejection from the $1.15 area will mean that the breakout will take longer to materialize. In that case, the KAVA price could fall to the ascending support line at $0.85 before eventually resuming its increase.
Read More: Best Crypto Sign-Up Bonuses in 2023
Will Near Protocol (NEAR) Confirm Bullish Reversal?
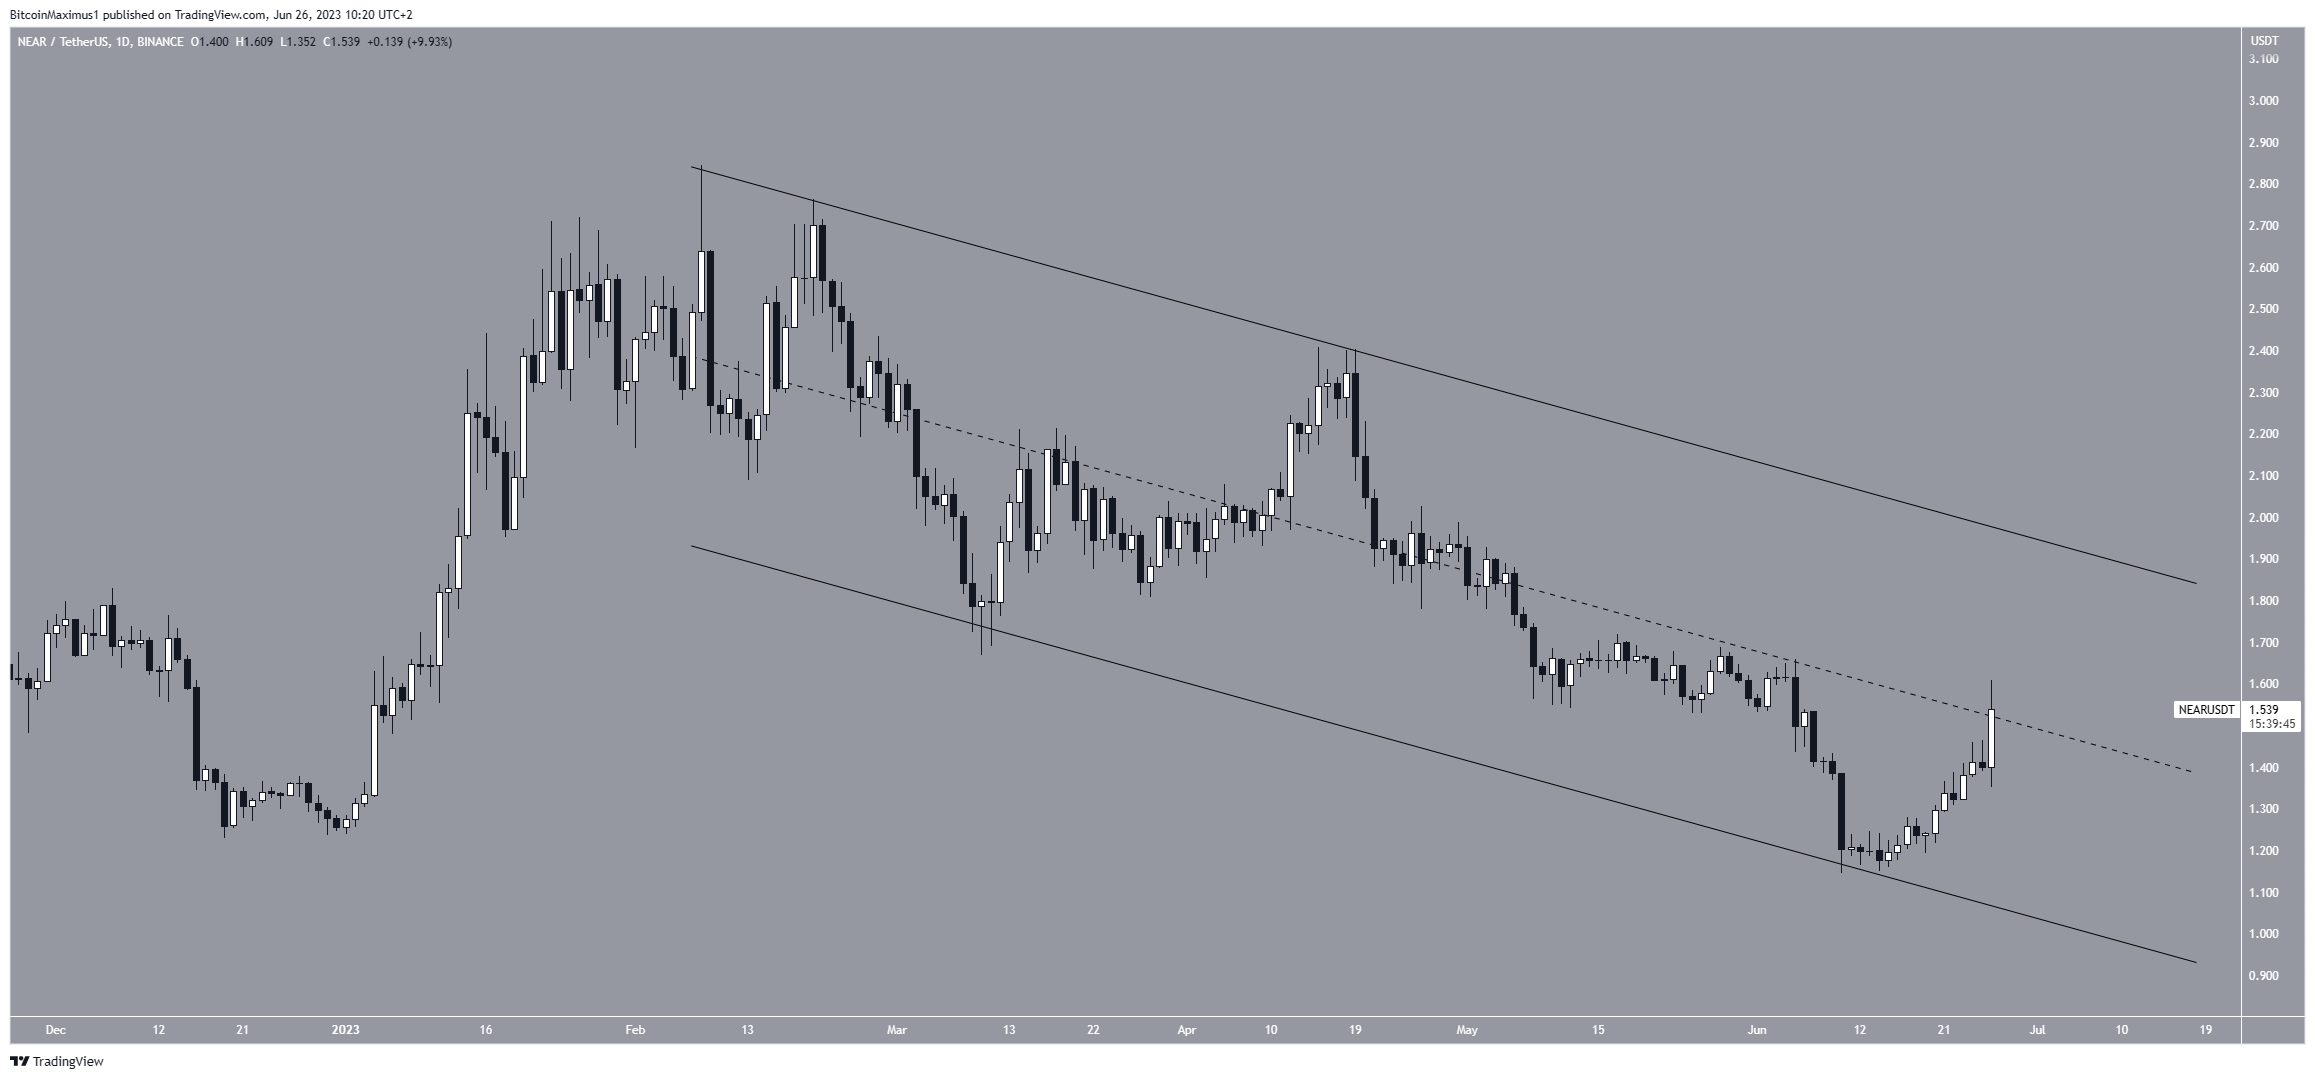
The NEAR price has decreased inside a descending parallel channel since the beginning of February. The descending parallel channel is considered a corrective pattern. Therefore, in a similar fashion to the ascending triangle, a breakout from the channel is expected.
Currently, NEAR is in the process of moving above the channel’s midline. If a daily close above it occurs, it will greatly increase the chances of a future breakout. The price can move to the next resistance at $2.70 in that case.

However, if the NEAR price gets rejected by the channel’s midline, it could fall to the support line at $1.
 beincrypto.com
