- 1 PAX gold price is currently trading at $1909 while witnessing a gain of 0.05% during the intraday session.
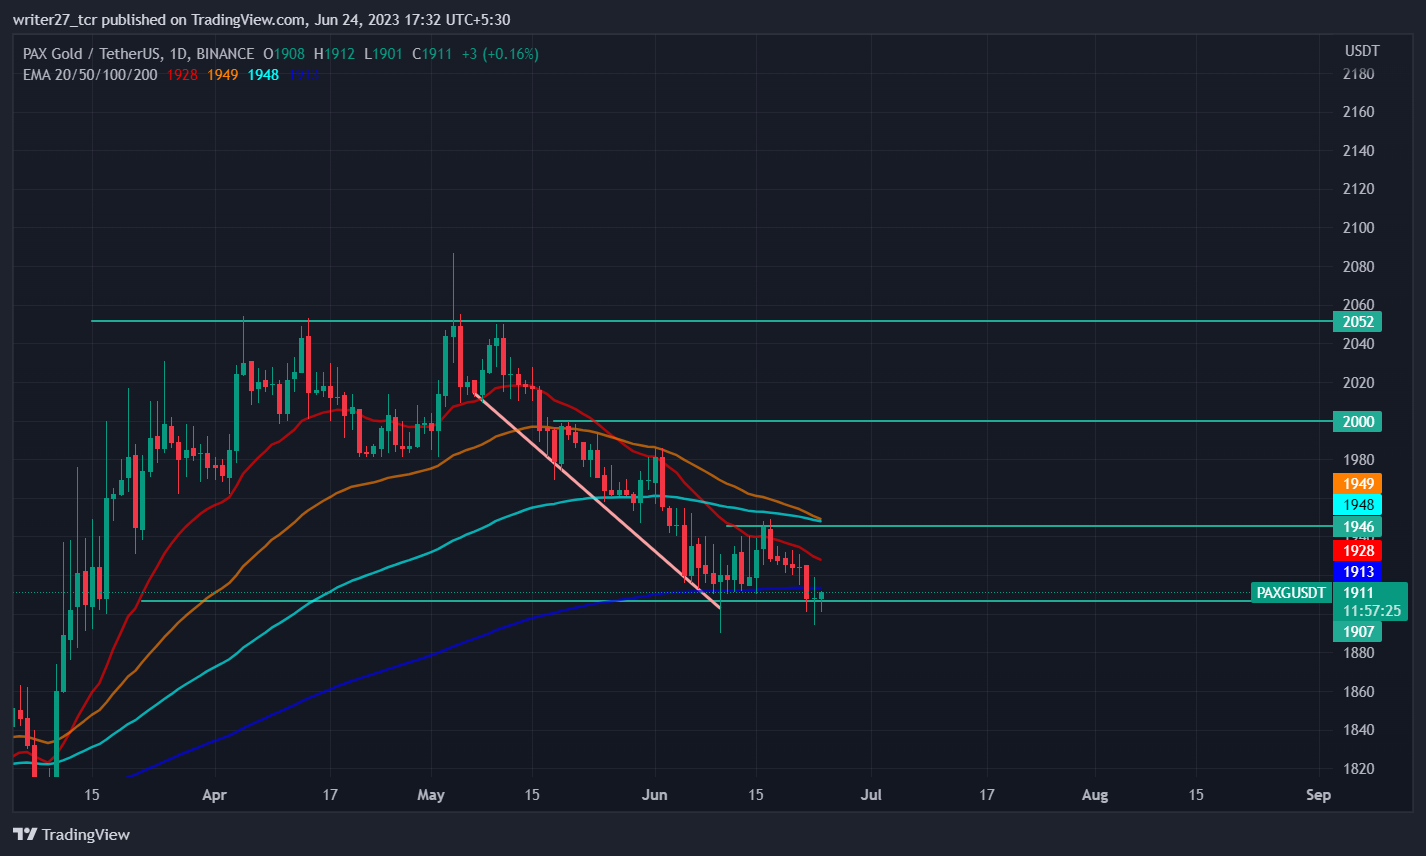
- 2 $PAXG Price trades below 20,50,100 and 200-day EMAs.
- 3 The year to date return of $PAXG is 4.77% while three month return is -4.41%.
$PAXG price has been in a downtrend since the start of May, 2023 as price received rejection from $2087 level. The cryptocurrency price entered into a downtrend, forming lower lows and reached to $1900 level.
Currently, PAX gold price is struggling to stay above $1900. The previous did fall below $1900 but buyers entered the market and pushed the price back above $1900. The price has formed support at $1909 level and the current candle is bullish headed toward the next resistance level of $1946.
If the Pax Gold price can break the lower wick and close below $1900, there is a high probability for the price to meltdown toward the next support level of $1800 level. For the price to regain bullish momentum, it needs to rise above $2000. A fall to $1800 will cause a price loss of 5.26%.

The market capitalization of Pax gold has increased by 0.39% to $487 Million. The 24 hour volume is down by 27.85% suggesting a decrease in investors interest. The price is down by 45.23% from the all time high of $3487.68.
Will $PAXG Price Rise to $2000 Level?

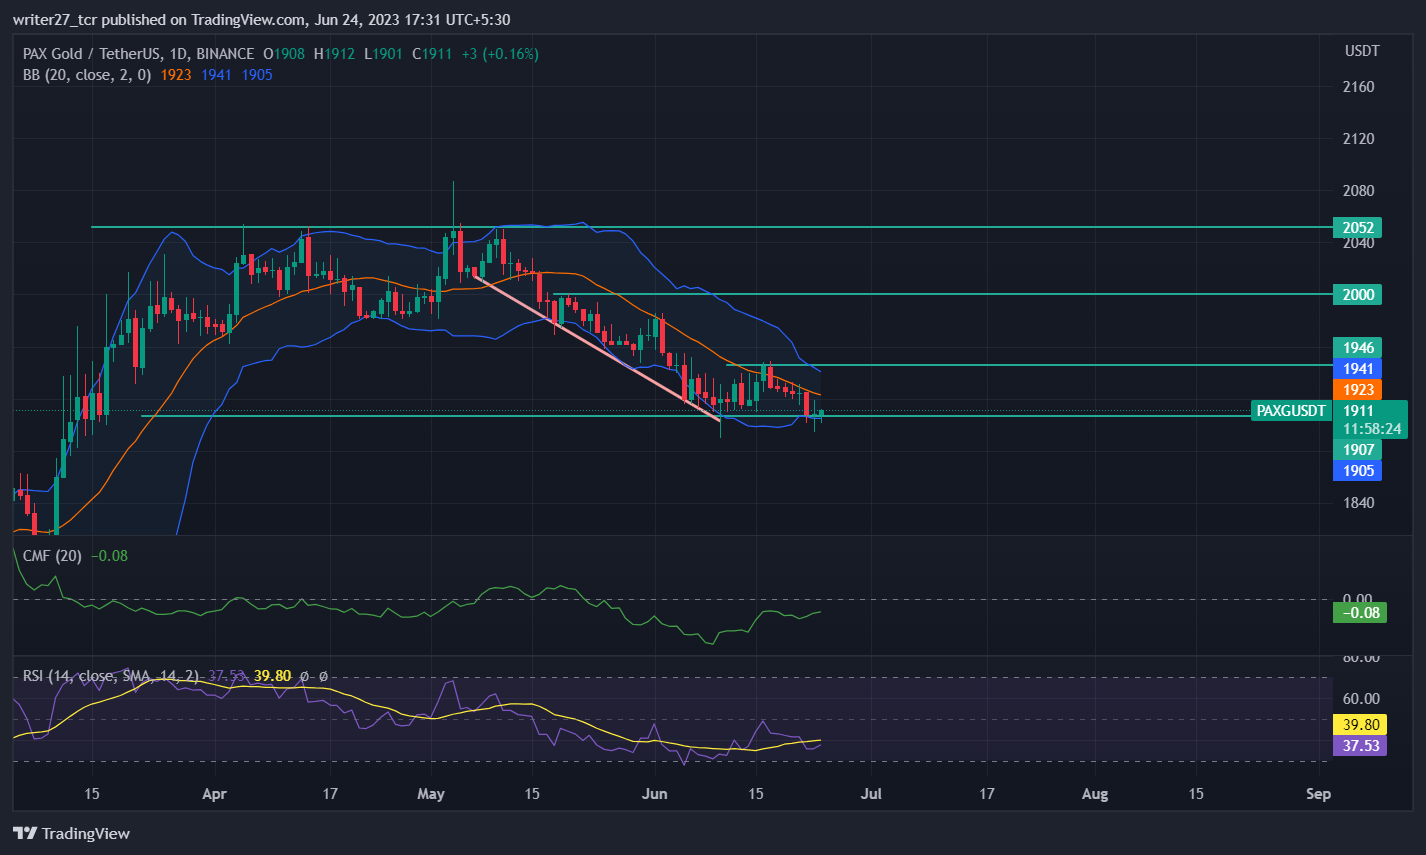
PAX gold price trades below 20,50,100 and 200-day EMAs indicating bearish momentum in the market. The chaikin money flow score is -0.08 indicating slight weakness in the price. CMF has been below the 0 mark since the end of June, suggesting the momentum of bears. The current candle has been receiving the same from bulls as well as bears and is currently looking like a Doji candle.
The relative strength index touched the oversold region and began to rise, RSI currently trades at 36.91 indicating bearish momentum in the price. Also, RSI has not crossed above 50 mark. The bollinger bands have contracted indicating low volatility in the market.
Currently, Pax gold is hovering near the lower band of bollinger and striving to rise above the 20-day SMA. The long/short ratio of Pax gold is 0.90 with 47.52% longs and 52.48% shorts indicating increased participation of sellers in the last 24 hours.
Conclusion
The market structure and price action of Pax gold is currently bearish. The price is trying to stay above $1900. The previous candle did break below the $1900 but bulls price back above it. The technical parameters are favouring the seller side as price has been in a downtrend.
Traders should wait for the price to close below $1900 so as to look for any sort of selling bids. The previous candle has closed as a reversal Doji candle which indicates possibility of pullback toward $1946 level.
Technical levels
Major support: $1900 and $1800
Major resistance: $1946 and $2000
Disclaimer
The views and opinions stated by the author, or any people named in this article, are for informational purposes only. They do not establish financial, investment, or other advice. Investing in or trading crypto assets comes with a risk of financial loss.
 thecoinrepublic.com
