The Stacks (STX) price bounced at a long-term support area last week and accelerated its increase on June 20.
It is possible that the price is in the first stages of a long-term upward movement that will take it to a new yearly high.
Stacks Price Bounces, Validating Crucial Support
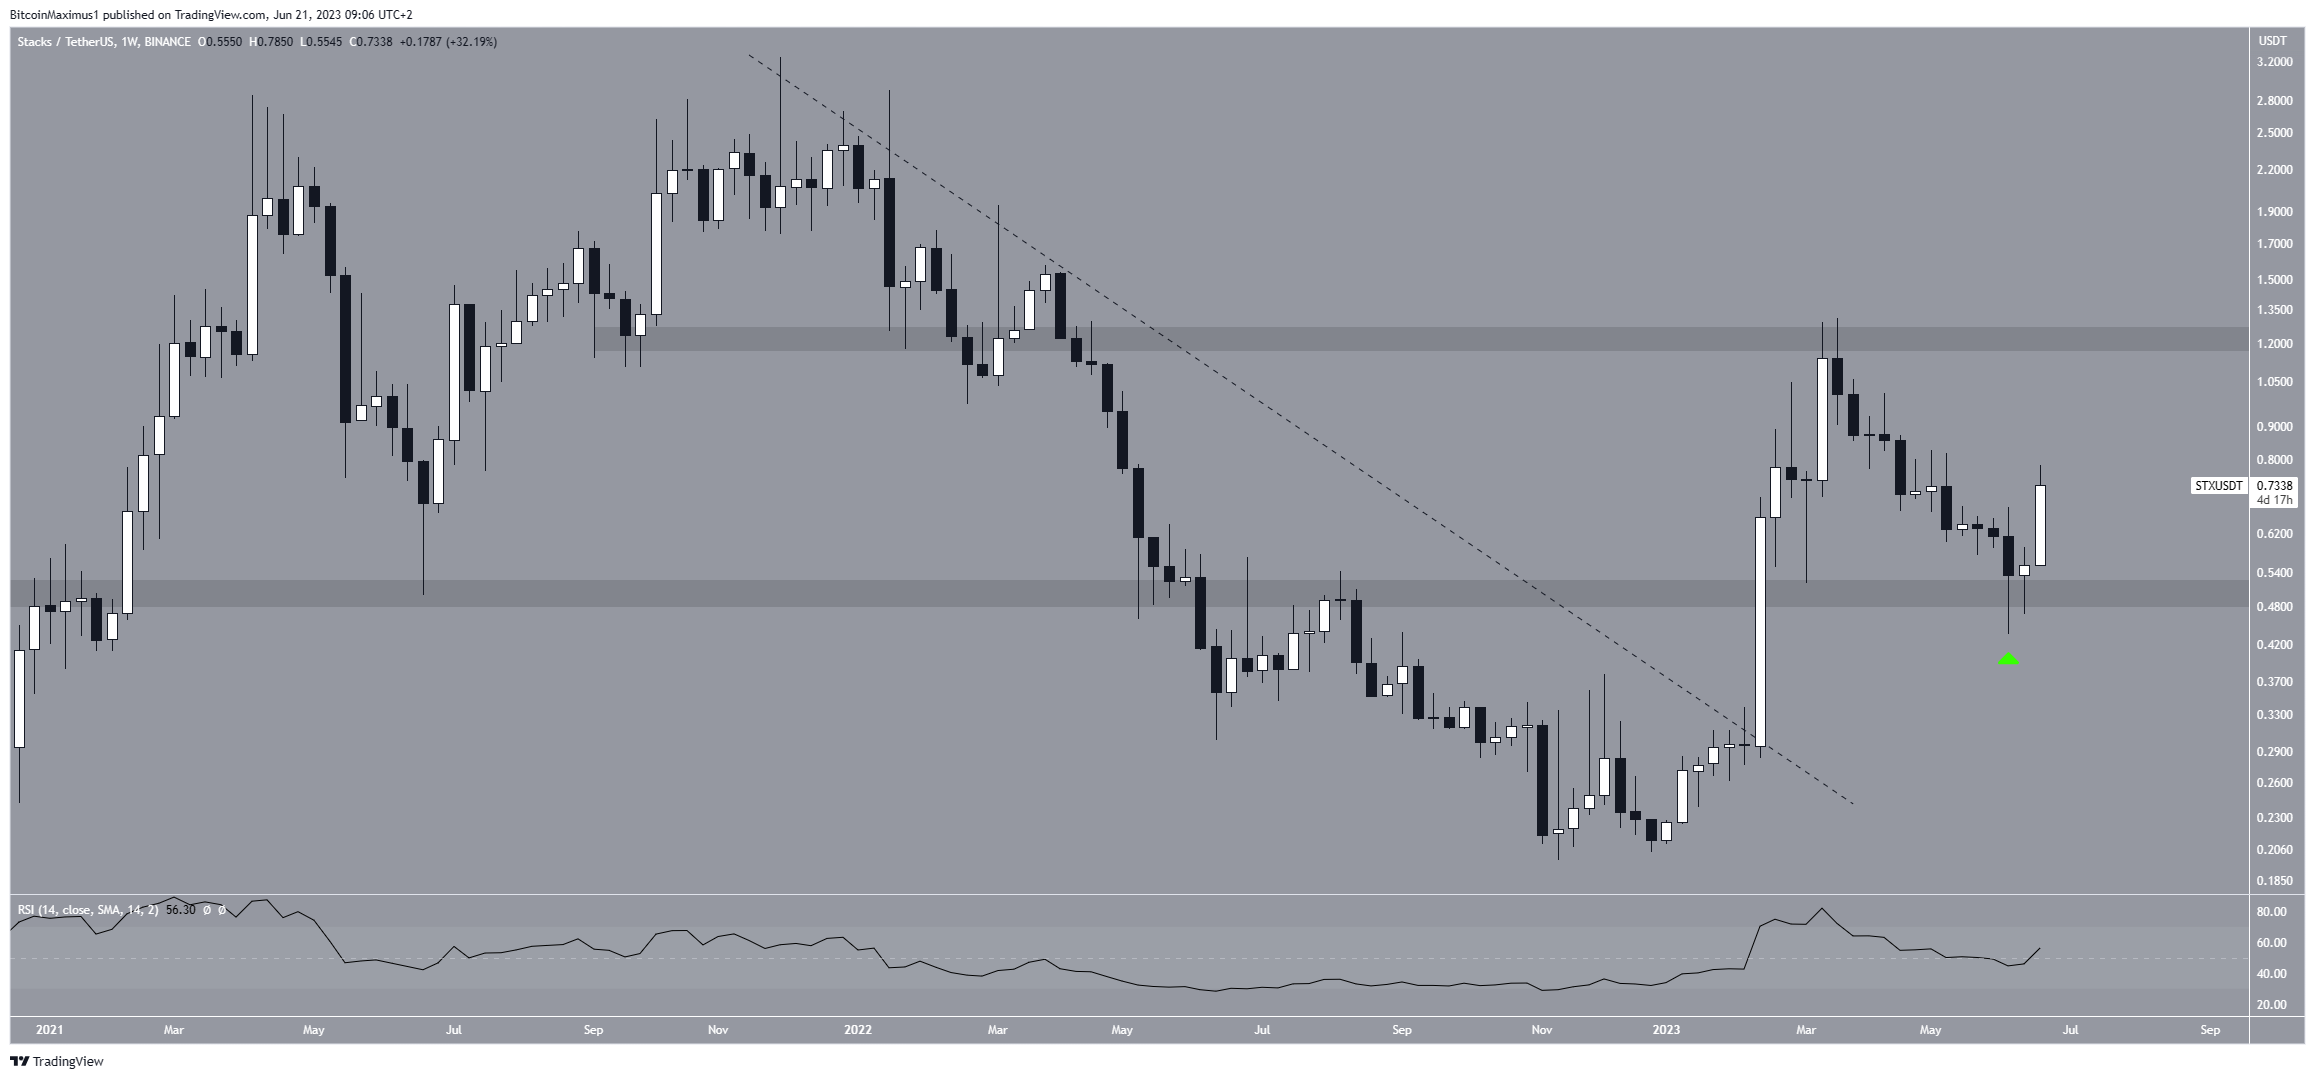
The price of STX broke out from a long-term descending resistance line in February. The ensuing increase was swift, leading to a new yearly high of $1.31 on March 20.
However, the price failed to break out from the $1.20 resistance area. Rather, it was rejected and fell to the closest support at $0.50.
Despite the decrease, STX bounced at the $0.50 area last week, validating it as support.

The Relative Strength Index (RSI) indicator also gives a bullish reading. Traders utilize the RSI as a momentum indicator to assess whether a market is overbought or oversold, and to determine whether to accumulate or sell an asset.
If the RSI reading is above 50 and the trend is upward, bulls still have an advantage, but if the reading is below 50, the opposite is true. The current reading is below 50, a sign of a bearish trend. After the bounce, the RSI quickly moved above 50, indicating a bullish trend.
More From BeInCrypto: 9 Best AI Crypto Trading Bots to Maximize Your Profits
STX Price Prediction: Is Wave Count Still Bullish?
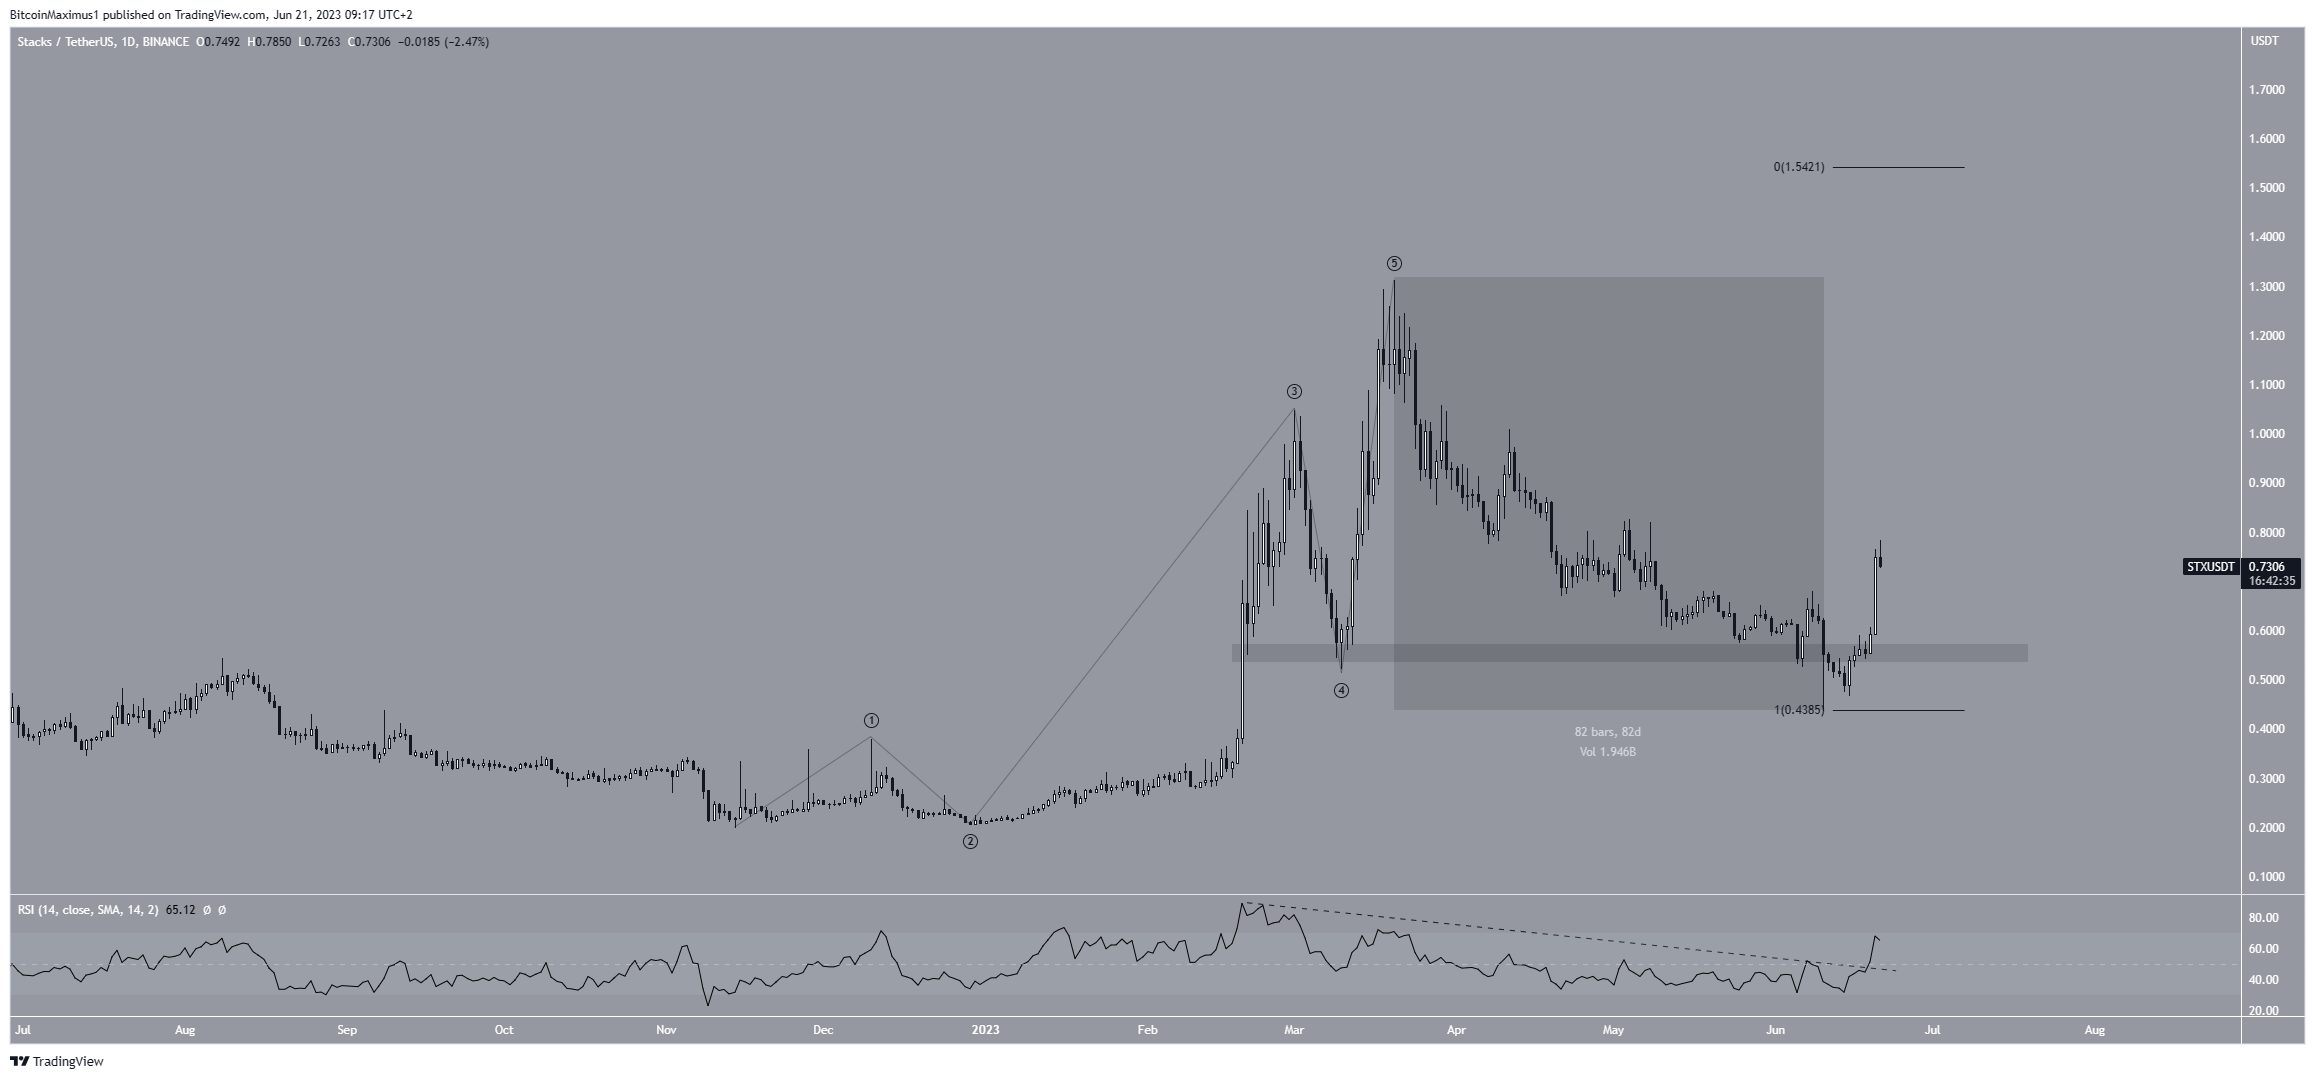
The technical analysis from the shorter-term daily time frame shows that the STX coin price could be in the initial stages of a long-term increase. The main reason for this comes from the wave count.
The count suggests that the increase that led to the yearly high is part of a five-wave upward movement (black). Then, the ensuing drop (highlighted) is a completed correction. If the count is correct, the STX price began a new upward movement after bouncing at the long-term horizontal support of $0.50 was the end of the correction.
The price action from the daily time frame also supports this since the STX price reclaimed the minor $0.55 horizontal support area after initially falling below it.
Finally, the daily RSI broke out from a descending trendline and moved above 50. This is another sign of a bullish trend.
If the ensuing increase has the same length as the preceding one, the STX price will increase to $1.54.

Despite this bullish STX price prediction, a drop below last week’s low of $0.44 will mean the trend is still bearish.
In that case, the STX price could fall to a new yearly low, possibly reaching the $0.15 region.
 beincrypto.com