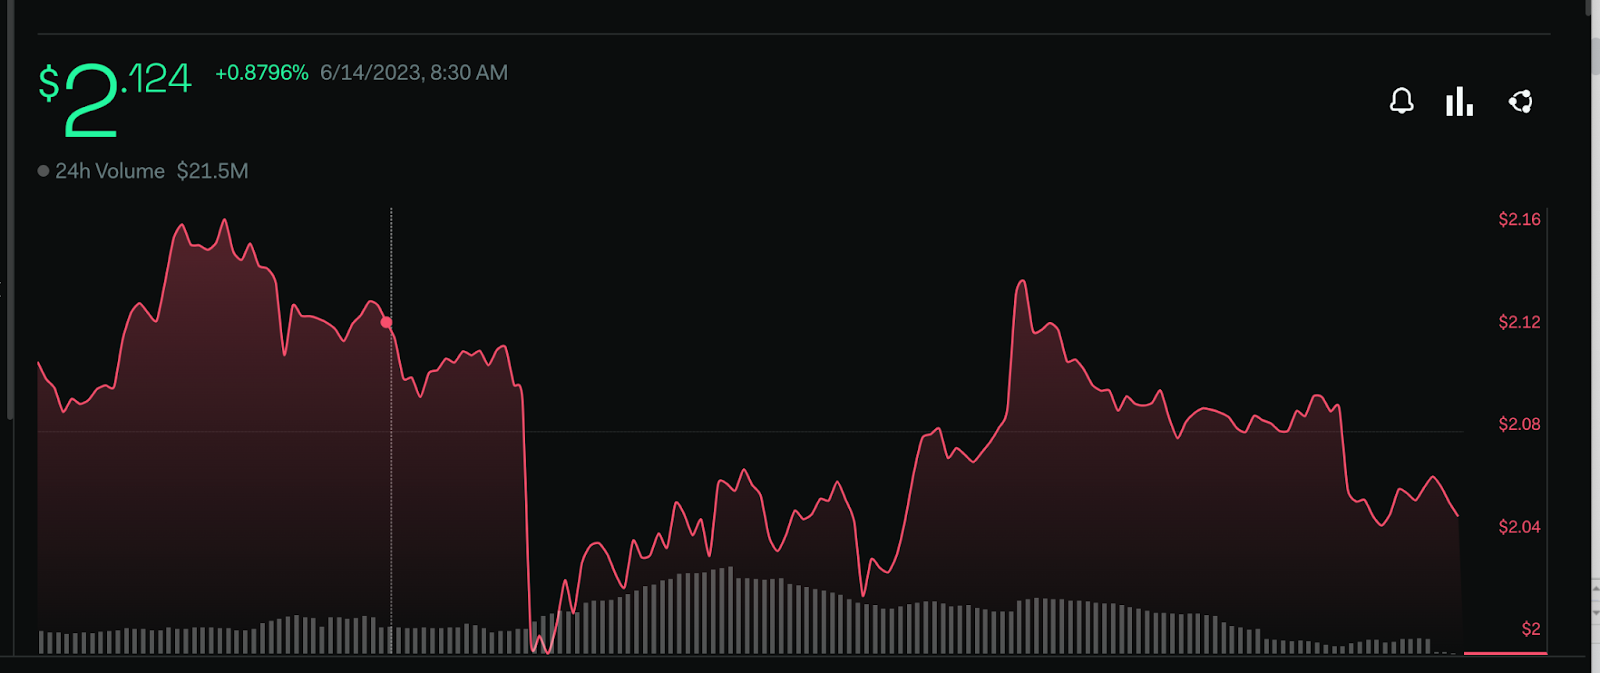
- 1 QTUM price is currently trading at $2.124 with a 7.8% fall in its 24-hour trading volume.
- 2 QTUM price is down by 2.92% in the last 7 days on the daily chart.
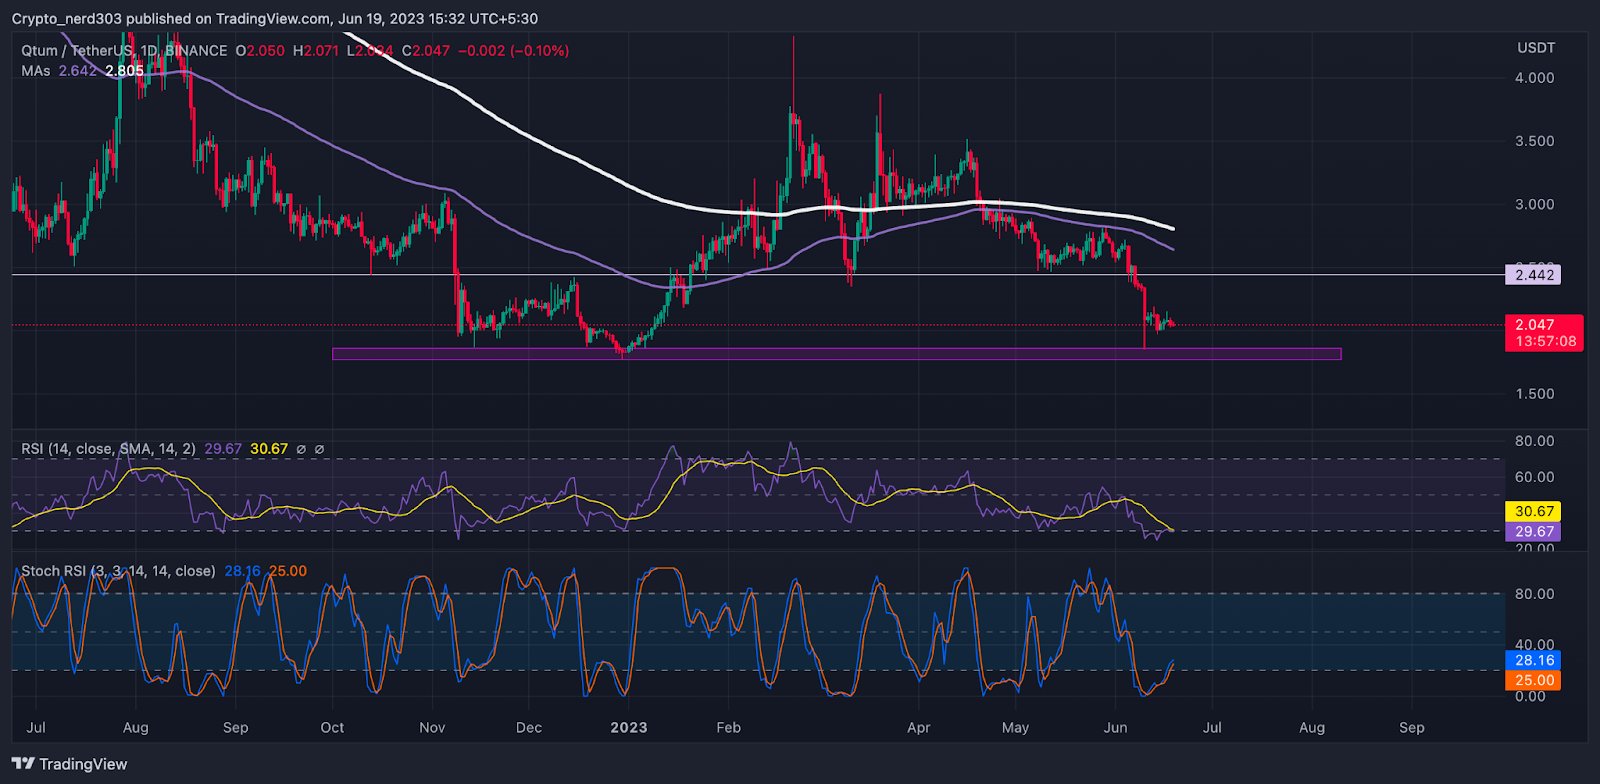
Presently, QTUM price is observing a grave fall of 26.92% after facing rejection from the 100-day EMA level. QTUM price is momentarily tracking the major cryptocurrencies closely. The price is trading below crucial EMA levels after breaking its support zone at the daily timeframe. The price action implies that the value of the QTUM token may see an additional decline in its value due to the influence of bears in the market.
For the past few weeks, the price of the QTUM token has been observing severe selling pressure in its value. Some renowned cryptocurrencies are witnessing a fall of 7% with bearish momentum. The fall is impacting the overall market.
Presently, the value of the QTUM token is $2.124 and it has a market cap of $214.53 Million.
Investors Showing A Decline In Bullish Optimism
 QTUM Price Prediction: Bulls Hesitate To Support QTUM Price ">
According to LunarCrush, the investors are currently hesitant to support the token further but their perspective may change once the price approaches the support zone. The total bullish sentiment parameter has depreciated by 11.2%. By contrast, the total social engagement metrics have surged by 54.7% indicating that not many investors are engaged with the token across various social media platforms.
The 24-hour trading volume has depreciated slightly by 7.8% in the past few weeks.
Technical Analysis of QTUM Price on the Daily Chart
 QTUM Price Prediction: Bulls Hesitate To Support QTUM Price ">
The RSI line is presently just below the 14-day SMA on the daily timeframe. The RSI line is moving near 29.87 points and the 14-day SMA is providing resistance to it at around 30.64 points. The RSI line indicates that the price of the QTUM token may soon attempt to make a positive rebound once the RSI line makes a breakout through the 14-day SMA.
The %D and %K lines recently intercepted the 20 RSI zone. The present value of stochastic RSI is 28.16 points.
Conclusion
The price of QTUM is presently moving below the major EMA levels. Historical chart patterns show that the price always comes for a retest from the EMA levels. The oscillators are exhibiting that the price of the QTUM token is undervalued. Investors are presently hesitant regarding the positive recovery of the token.
Technical levels
Support – $1.500 and $1.000
Resistance – $2.500 and $3.000
Disclaimer
The views and opinions stated by the author, or any people named in this article, are for informational purposes only, and they do not establish financial, investment, or other advice. Investing in or trading crypto assets comes with a risk of financial loss.
 thecoinrepublic.com
