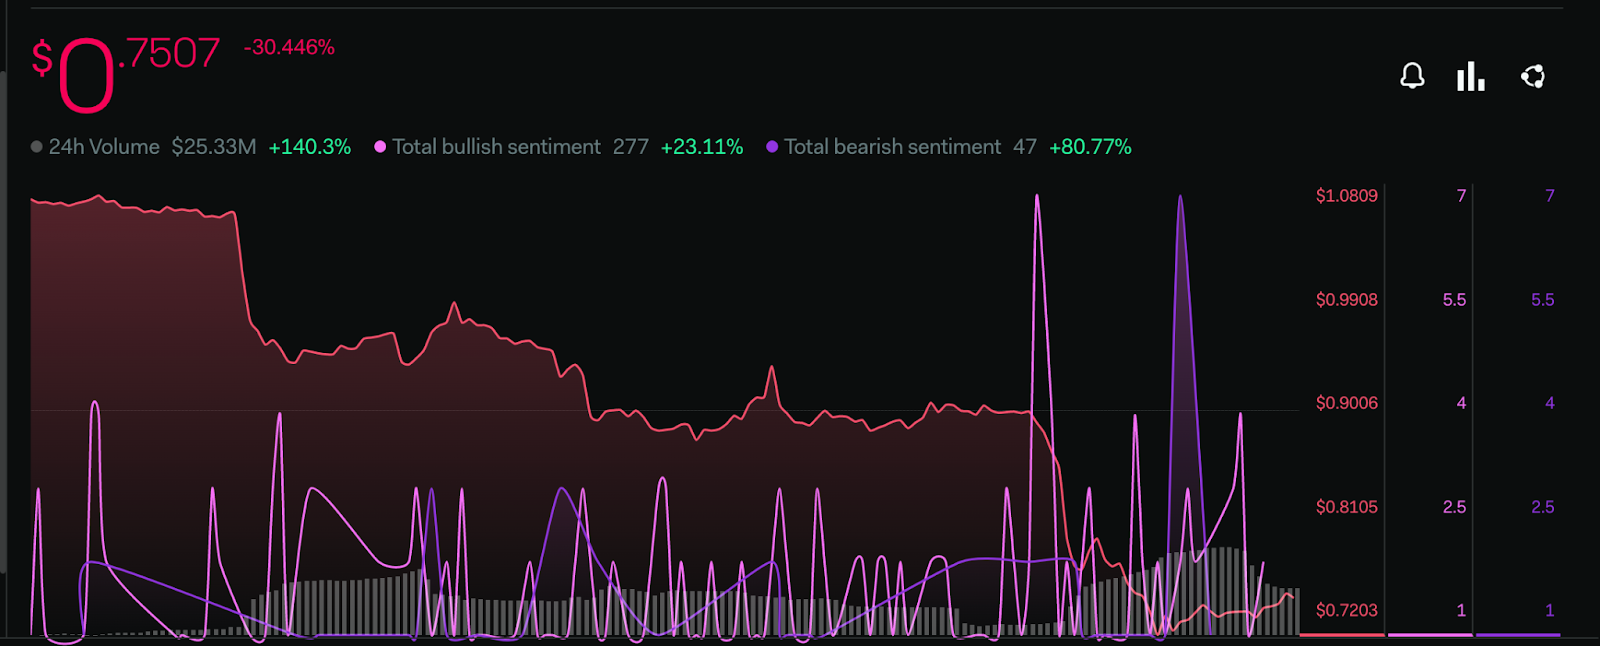
- 1 TWT is currently trading at $0.750 with a rise of 140.3% in the 24-hour trading volume.
- 2 The price of TWT recorded a decline of 30% in the last 24 hours.
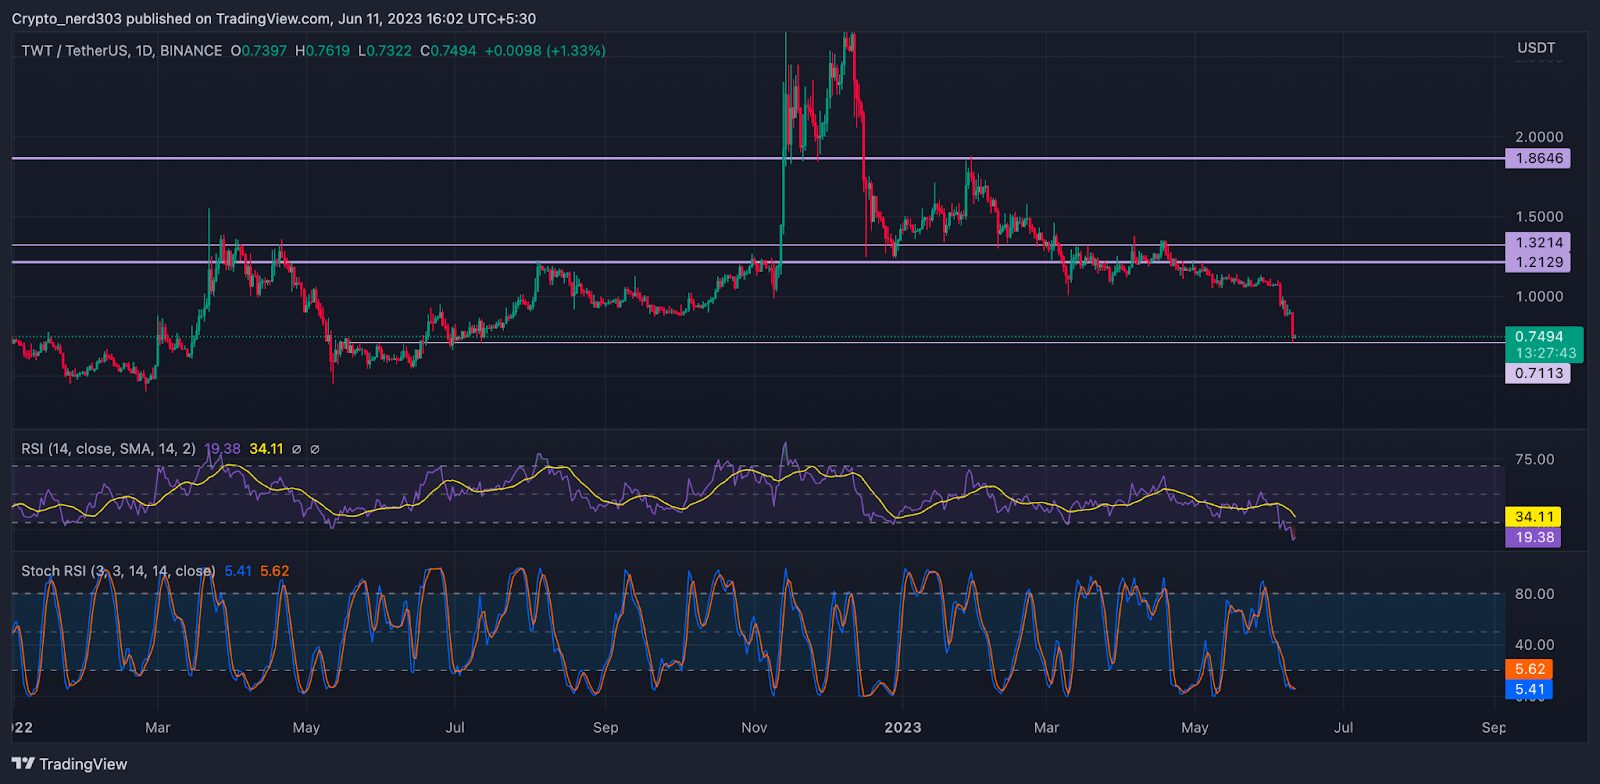
The TWT price recently made a breakdown through its consolidation channel. It is presently trading below all the major EMA levels observing a severe decline in value. The long red candlestick pattern suggests that there is a strong presence of sellers in the market.
The majority of the technical indicators suggest a bullish outlook concerning the near future. The bulls may find it challenging to take back control of the price action. The price is trading under the dominance of bears, seeing a decline of 34%.
The oscillators RSI and stochastic RSI are at present also trading near oversold levels indicating that the Trust Wallet Token is underpriced. The current value of the TWT token is $0.75 and it has a market cap of $313.67 Million, observing a subtle surge over the past few days. The price will require significant buyer support in order to make a recovery within the next few days.
Rise of Bearish Sentiments in the TWT Price

The Investor’s sentiments regarding the TWT price surged over the past few days. The total Bullish Sentiment metrics have risen by 24.34%. However, the buyer’s buoyant opinions may get overshadowed by the bears. There is an increase of 80.77% in the total bearish sentiments.
Technical Analysis of TWT Price

The RSI line is trading below the 30 RSI points on the one-day chart. At present, the RSI line is trading at 57.34 points, whereas the 14 SMA is trending just below the 50 RSI point at around 46.17 points.
The stochastic RSI is moving near extreme oversold levels, after making a double top. The %K line indicates that it may soon give a negative interception to the %D line near 14 points. At present, the value of the stochastic RSI is 5.41 points.
Conclusion
According to the analysis, If the price is supported by the investors, it may continue moving on a bull trend. The RSI and stochastic RSI are moving near extreme oversold levels on the one-day chart indicating that the value of Trust Wallet Token is underpriced and if it does not find the buyers support, it may see decline further.
Technical Levels:
Support –$0.1500
Resistance – $0.1000
Disclaimer:
The views and opinions stated by the author, or any people named in this article, are for informational purposes only, and they do not establish financial, investment, or other advice. Investing in or trading crypto assets comes with a risk of financial loss.
 thecoinrepublic.com
