Despite May being a bearish month for the cryptocurrency market, these four altcoins, considered top cryptos in June, managed to preserve most of their gains and even record a positive performance.
June has the potential to be a very important month for the altcoin market. If the market sees a bounce during this time, some altcoins could recover their previous losses and even reach new all-time highs.
This makes it an exciting time for traders and investors to closely monitor the market movements and take advantage of potential opportunities. BeinCrypto looks at four cryptos that could hit new all-time highs in May:
Can TomoChain (TOMO) Sustain its Massive Increase?
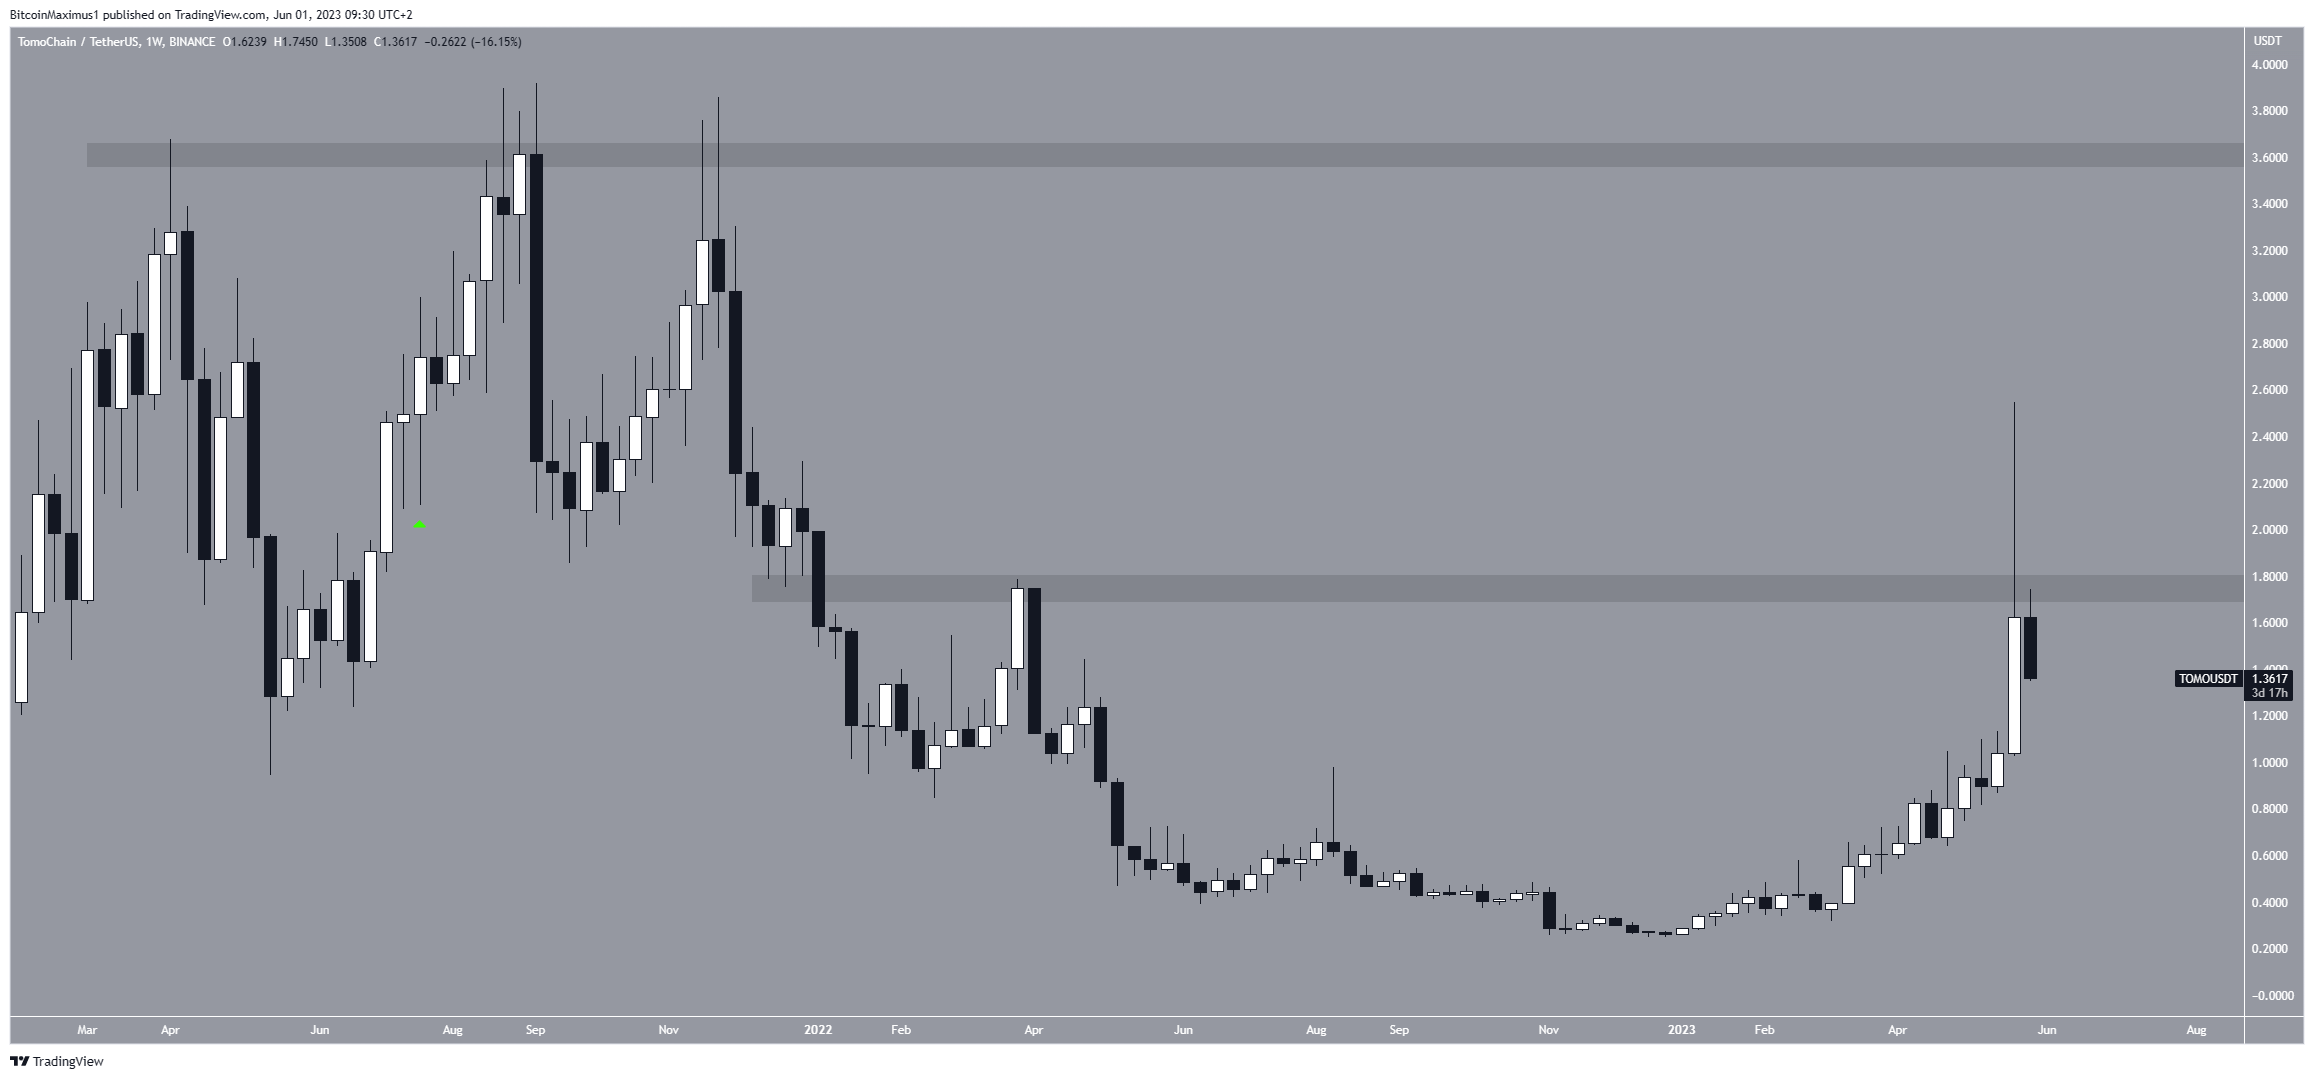
The TOMO price was subject to a massive increase last week, reaching a new yearly high of $2.55. However, the upward movement could not be sustained.
Rather, the TOMO price created a long upper wick, which is considered a sign of selling pressure (red icon).
Moreover, the wick caused the TOMO price to fall below the $1.70 horizontal area, which is expected to provide resistance. While the deviation above the area is a decisive bearish sign, no more resistance remains until the all-time high near $3.60.
So, if the TOMO price clears the $1.70 area, it can increase rapidly toward this area and possibly reach a new all-time high.

However, if the rejection continues, the TOMO price could instead turn bearish and fall to $1.
Injective (INJ) Cryptocurrency Price Aims for Continuation
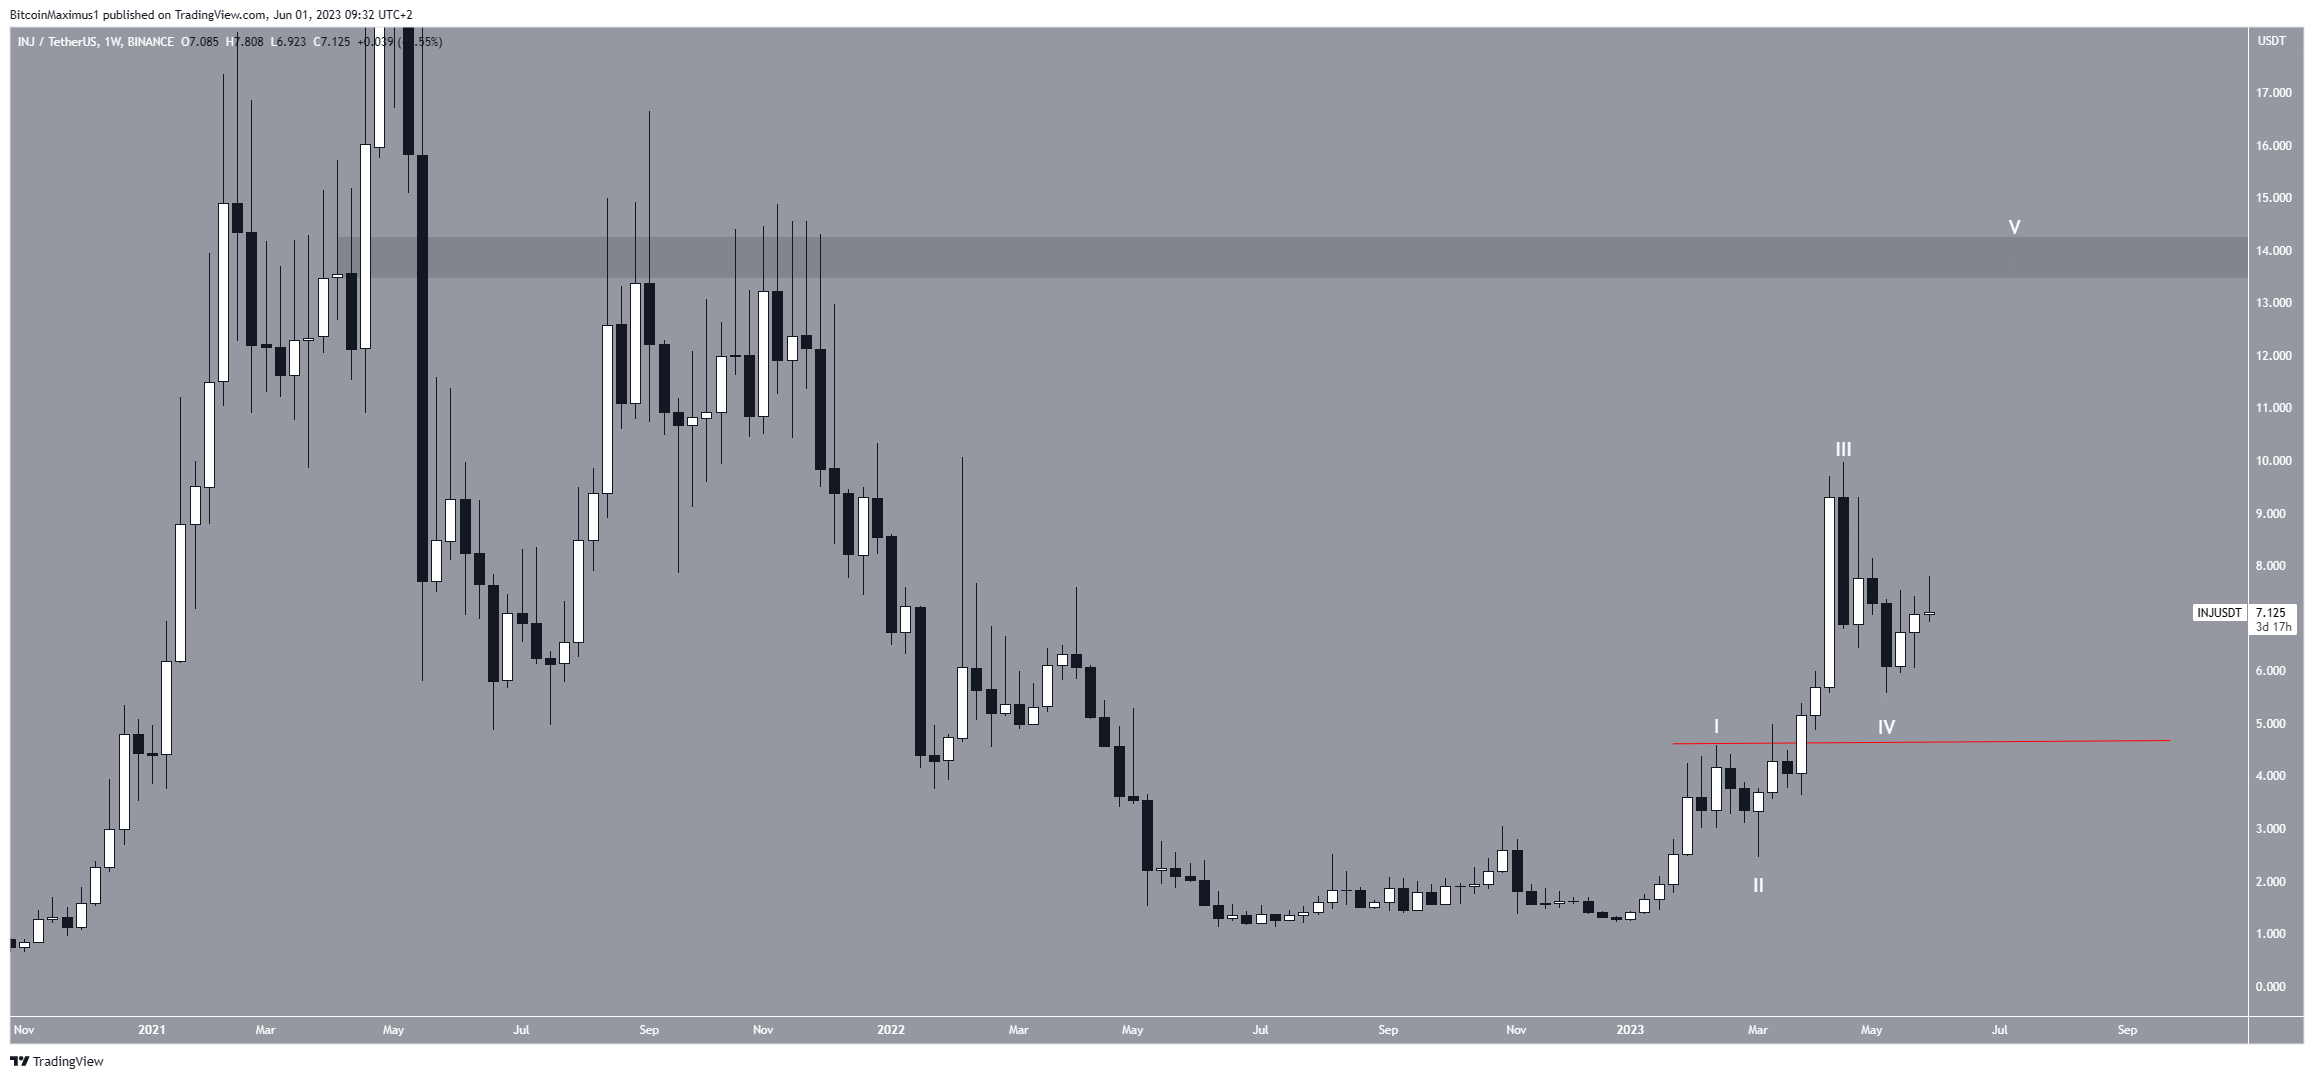
The INJ price has increased rapidly since the beginning of the year. The increase resembles a five-wave upward movement (white). If so, INJ is currently in the fifth and final wave of this increase.
Technical analysts employ the Elliott Wave theory as a means to identify recurring long-term price patterns and investor psychology, which helps them determine the direction of the trend.
The INJ price will complete its fifth wave near the $14 horizontal resistance area if the count is correct. Even though this is considerably below its all-time high, it is the final resistance before it.
So, the price can move to a new all-time high if it clears the $14 resistance.

However, a decrease below the wave one high (red line) at $4.58 will invalidate this bullish INJ prediction. In that case, the count would be bearish, and the price could fall toward $3.
RocketPool (RPL) Cryptocurrency Price Clears Major Resistance
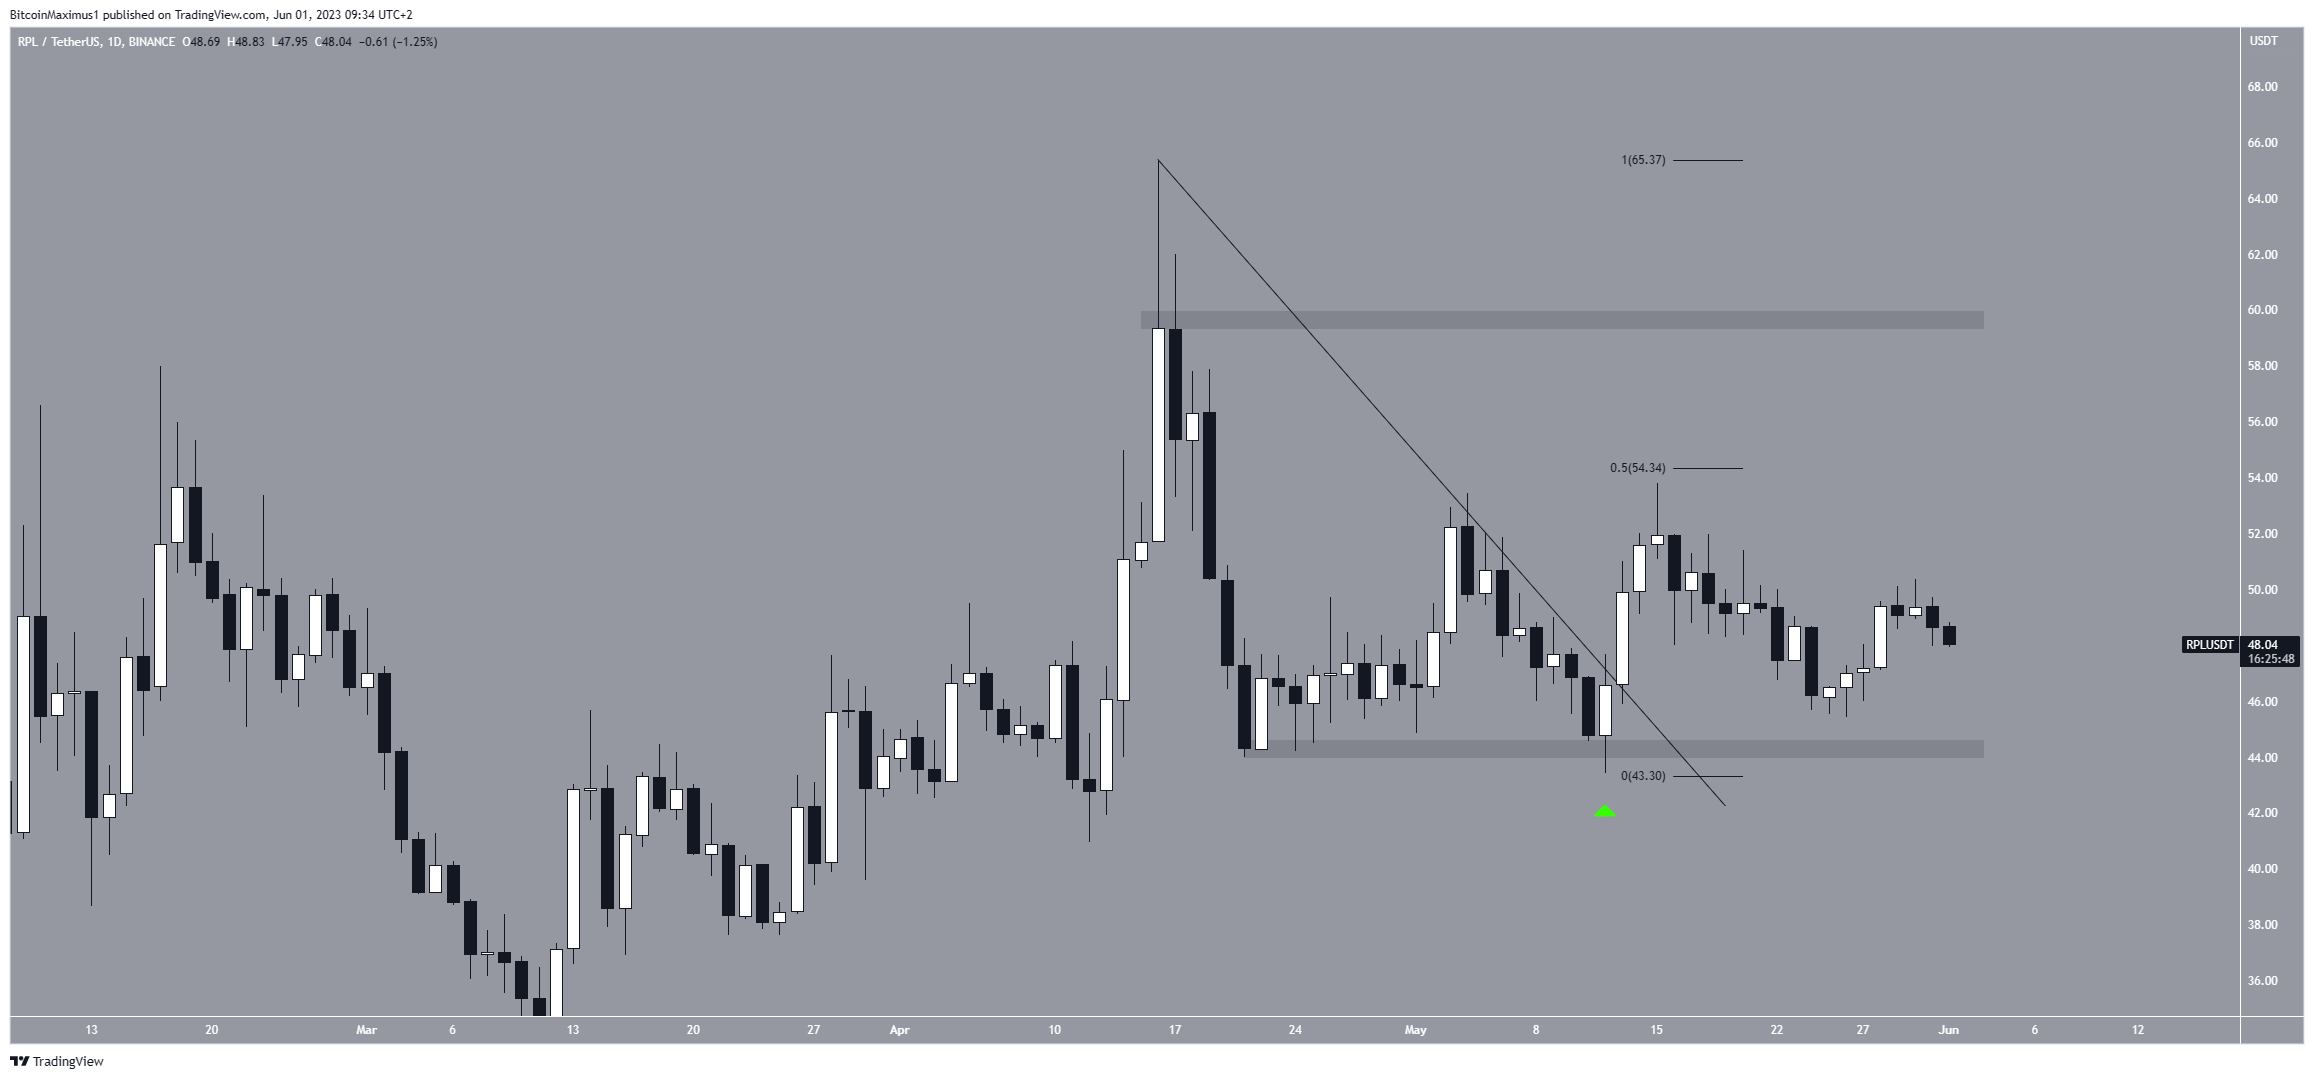
The RPL price had fallen below a descending resistance line since its all-time high of $65.32 on April 16. The decrease led to a low of $43.44 on May 12.
However, the price immediately bounced, creating a bullish candlestick (green icon). The next day, it moved above the descending resistance line, suggesting that the correction was complete.
Read More:
Staking Ether With RocketPool: Everything You Need To Know
While the price has fallen slightly since the breakout, it created a higher low on May 26. This is the first step in creating a bullish structure.

If the RPL price clears the 0.5 Fib retracement resistance level of $54.30, it is likely to move to a new all-time high.
However, a decrease to the $44 support area will be expected if it gets rejected.
Rootstock Infrastructure Price (RIF) Clears Long-Term Resistance
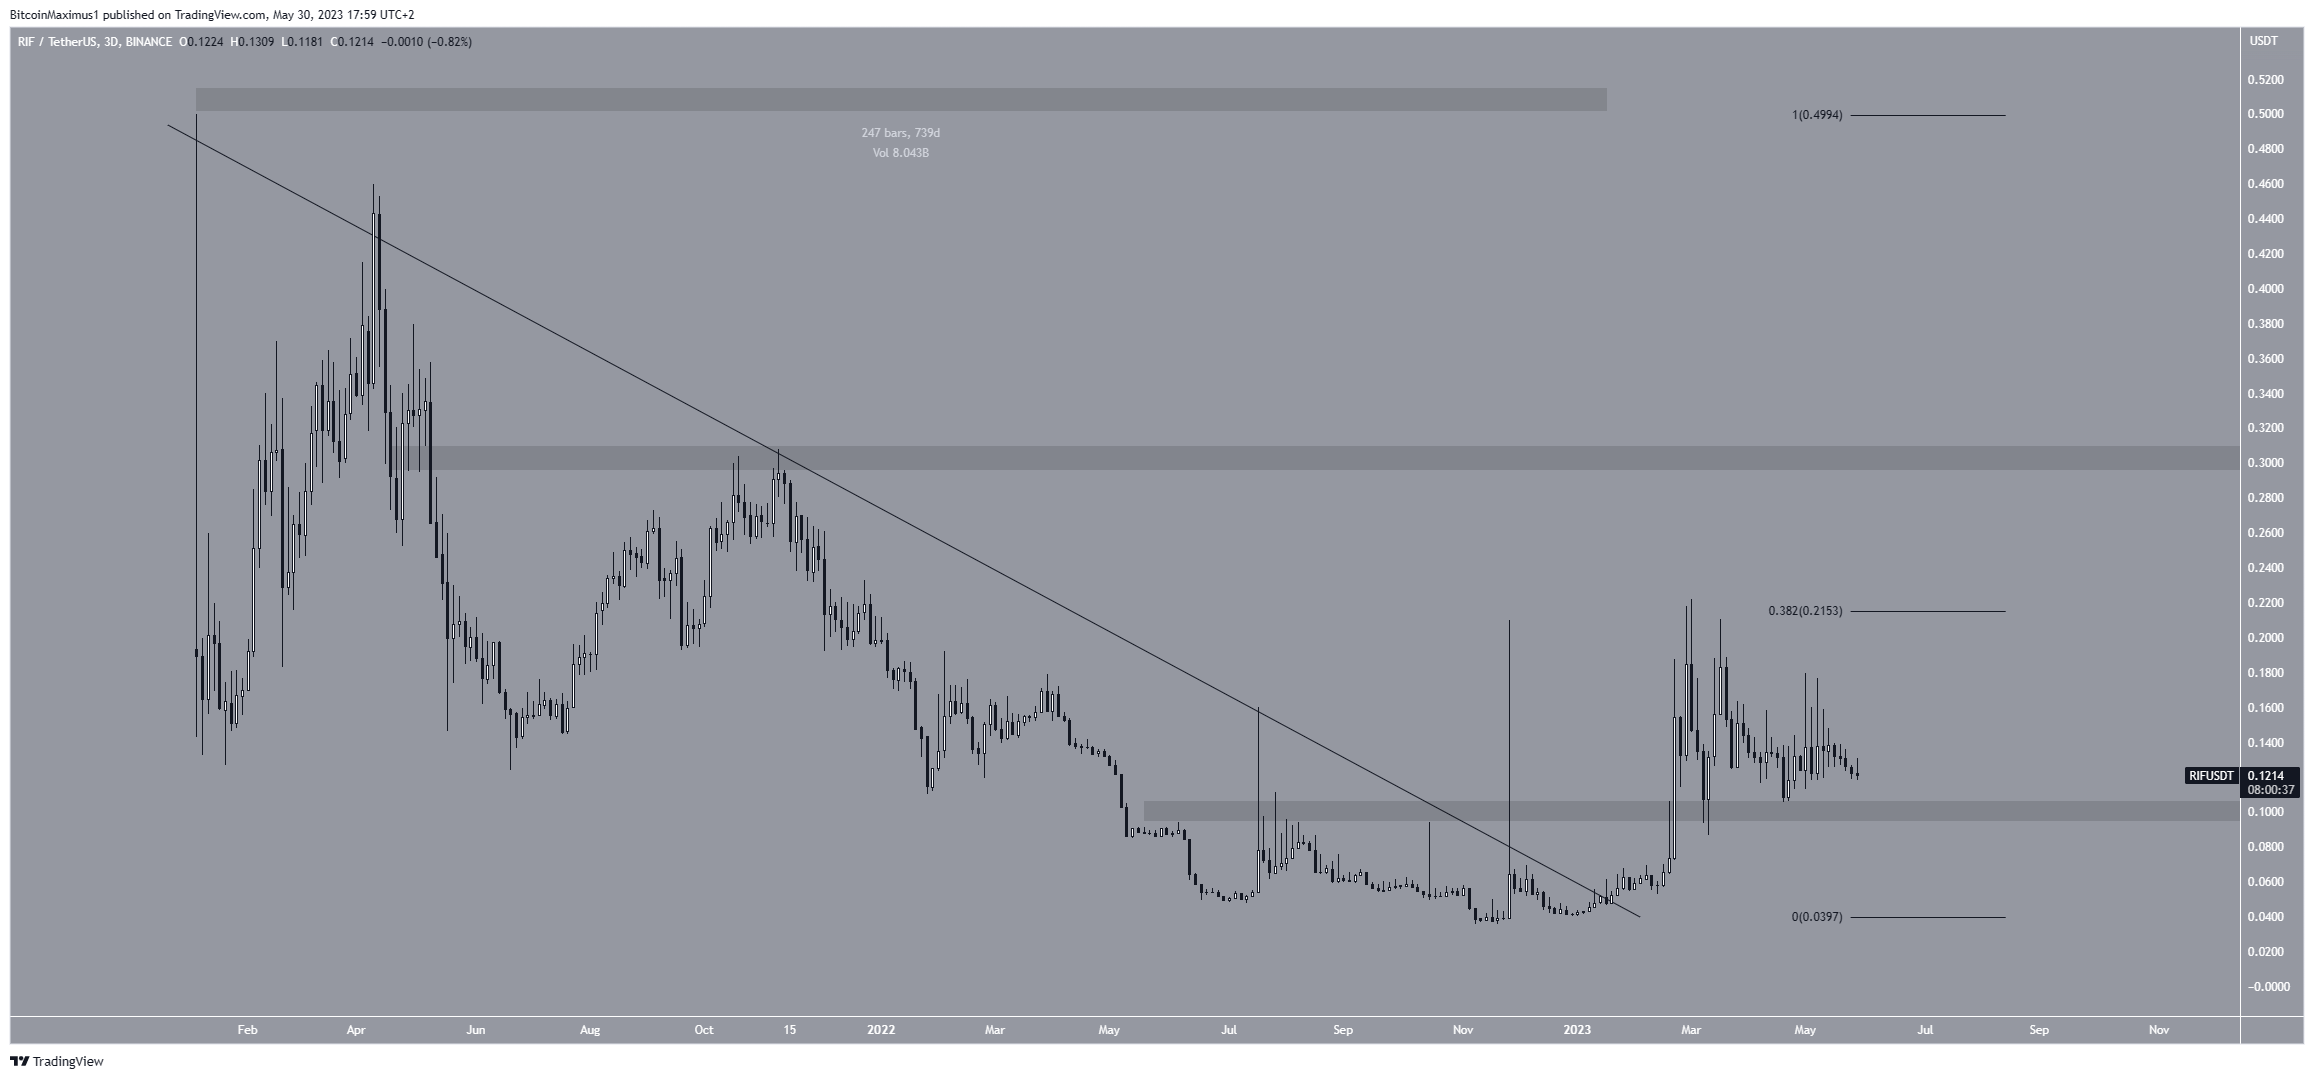
Concluding the top cryptos in June is Rootstock Infrastructure (RIF). The RIF price had fallen under a descending resistance line since its $0.50 high in Jan 2021. The decrease led to a new all-time low of $0.035 in November 2022, before the price reversed the trend, causing a breakout in January.
Before the breakout, the line had been in place for 740 days. Breakouts from such long-term structures often lead to significant bullish trend reversals.
This was the case in RIF, which reached a new yearly high of $0.22 in March 2023. However, the price has fallen since catalyzed by a rejection from the 0.382 Fib retracement resistance level.
Nevertheless, the price still trades above the $0.10 horizontal support area. As long as it does so, the trend can be considered bullish.

If the RIF price breaks out above the $0.22 Fib resistance, it can then increase to the next resistance at $0.30. However, if the price closes below $0.10, a drop to $0.04 could ensue.
 beincrypto.com
