
TL;DR Breakdown
- The Aave price analysis for today points to a bearish market.
- The price has been pushed down to $63.49.
- Can bulls locate alternative support to substitute for $64?
Today’s Aave price analysis suggests a persistently bearish scenario. The ongoing circumstances continue to favor the bears, with the price steadily declining. Presently, Aave is valued at $63.49, and there are indications that it may further descend in the near future. Such a development could potentially exacerbate the already significant decline in the cryptocurrency market. Nevertheless, there are discernible signs of support at approximately $62.22, as evidenced by the price rebounding after briefly touching this level earlier today.
$AAVE/USD 1-day price chart: Price dips below $64, intensifying challenges for sellers
The 1-day price chart for Aave price analysis indicates a bearish trend, with the price levels continuing to decline. Today, the price has even breached the crucial support level of $64, further intensifying the downward movement. At present, the $AAVE/USD price is positioned at $63.49 and is anticipated to venture into a lower range in the near future. It is worth noting that the moving average (MA) value on the price chart is currently observed at $64.65.
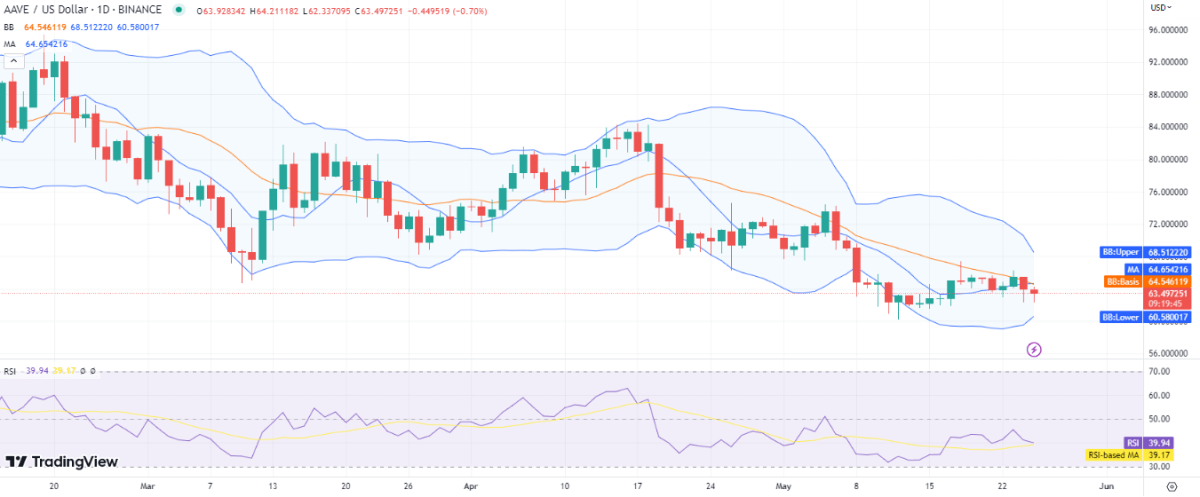
The bearish trend has remained steady since yesterday, accompanied by relatively mild volatility. The upper and lower Bollinger band values have converged at $68.5 and $60.5, respectively, serving as resistance and support levels. Additionally, the Relative Strength Index (RSI) has declined and currently sits at 39, indicating a lower level of strength in the market.
Aave price analysis: Recent developments and further technical indications
The hourly Aave price analysis indicates negative signals regarding recent trends. At the beginning of today’s session, there was a downward price breakout, but bulls attempted to intervene and provide support to the coin. However, their efforts have not yet recovered the losses, resulting in a significant setback. The current price stands below the previous support level of $64, specifically at $63.50. The moving average for the given price chart is relatively stable, positioned at $63.57.
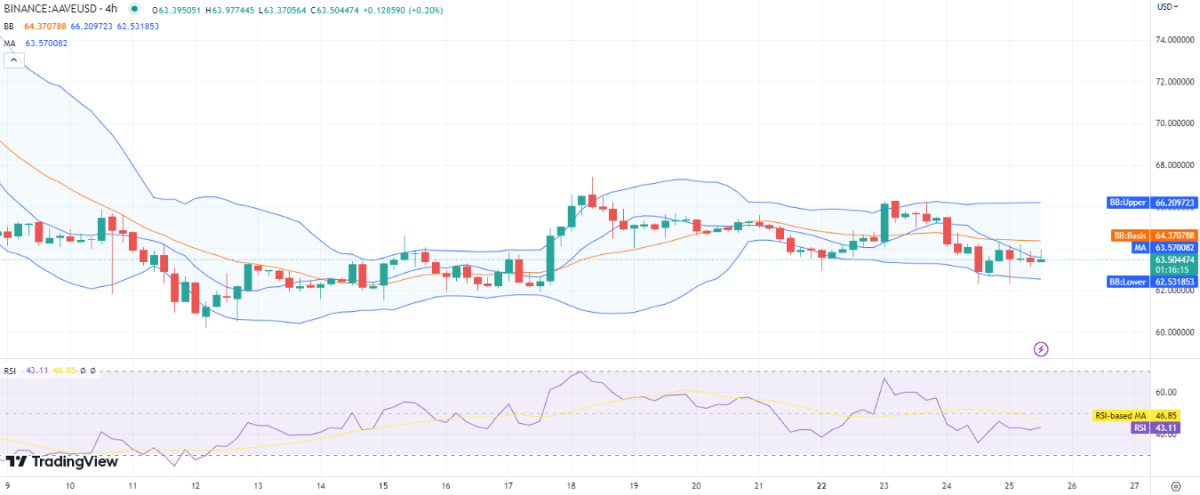
There have been notable changes in the Bollinger bands values due to increased volatility. Presently, the upper value has risen to $66.2, while the lower value is now at $62.5. Additionally, the RSI score has shown improvement, displaying an upward curve on the 4-hour chart with an index of 43. This suggests ongoing buying activity within the market.
Aave price analysis conclusion
The recent Aave price analysis, spanning 4 hours and 1 day, suggests that the price levels are now entering the lower range observed in the previous week. Additionally, the support level at $64 has been breached, indicating the need for new support below the $63 range if the bearish momentum persists. At present, the $AAVE/USD price rests at $63.50, with expectations of further downward movement. This sustained selling pressure may have negative implications for the overall price value. Nevertheless, there are glimpses of potential recovery, as evidenced by the 4-hour chart’s RSI providing indications of improvement.