
Polkadot price rose 1 percent over the past 24 hours . Price could reach $5.5 over the coming trading sessions . Resistance remains at $6 mark
Polkadot price analysis shows hints of an uptrend developing gradually, after price rose 1 percent over the past 24 hours to reach the $5.5 mark. After spending the current month in a sideways pattern, $DOT price has largely struggled just above the $5 support zone. After climbing up to $5.37 at the time of writing, Polkadot could head up to $5.5 over the coming trading sessions in the U.S. $DOT trading volume over the past 24 hours dropped slightly, while market cap went up to $7,170,186,213.
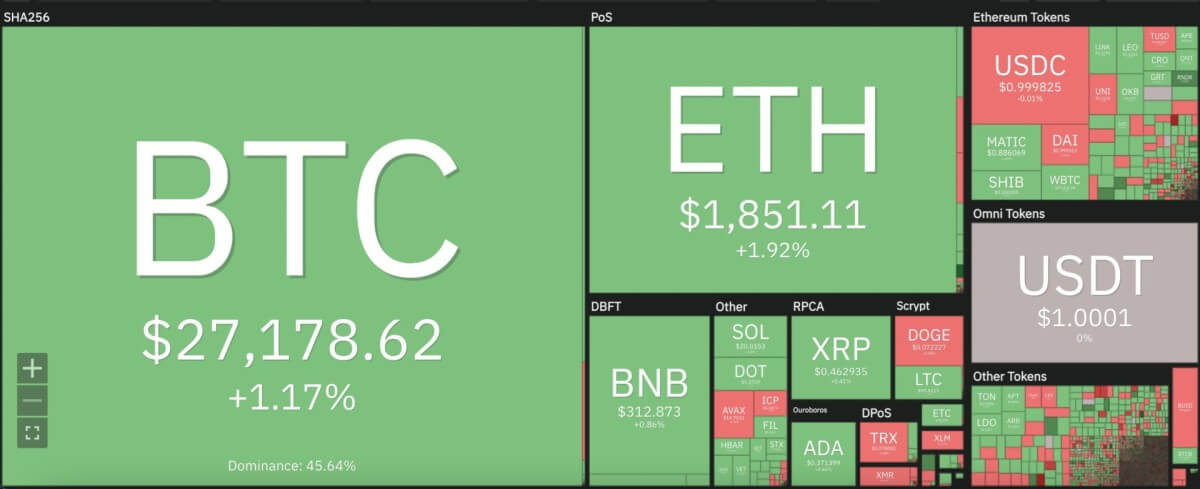
The larger cryptocurrency market showed minor recoveries over the past 24 hours, as Bitcoin rose 1 percent to $27,200, and Ethereum rose 2 percent to $1,850. Among leading Altcoins, Ripple stayed up to the $0.46 mark, with Cardano keeping at $0.37 and Dogecoin dropping 1 percent to move down to $0.07.
Polkadot price analysis: RSI gradually rise upwards on daily chart
On the 24-hour candlestick chart for Polkadot price analysis, price can be seen mostly trending in a horizontal pattern around the $5.3 mark. However, the latest day candlestick shows some promise of an uptrend as price rose up to $5.45. The increment took $DOT price above its 9 and 21-day moving averages, as well as the crucial 50-day exponential moving average (EMA) at $5.34.
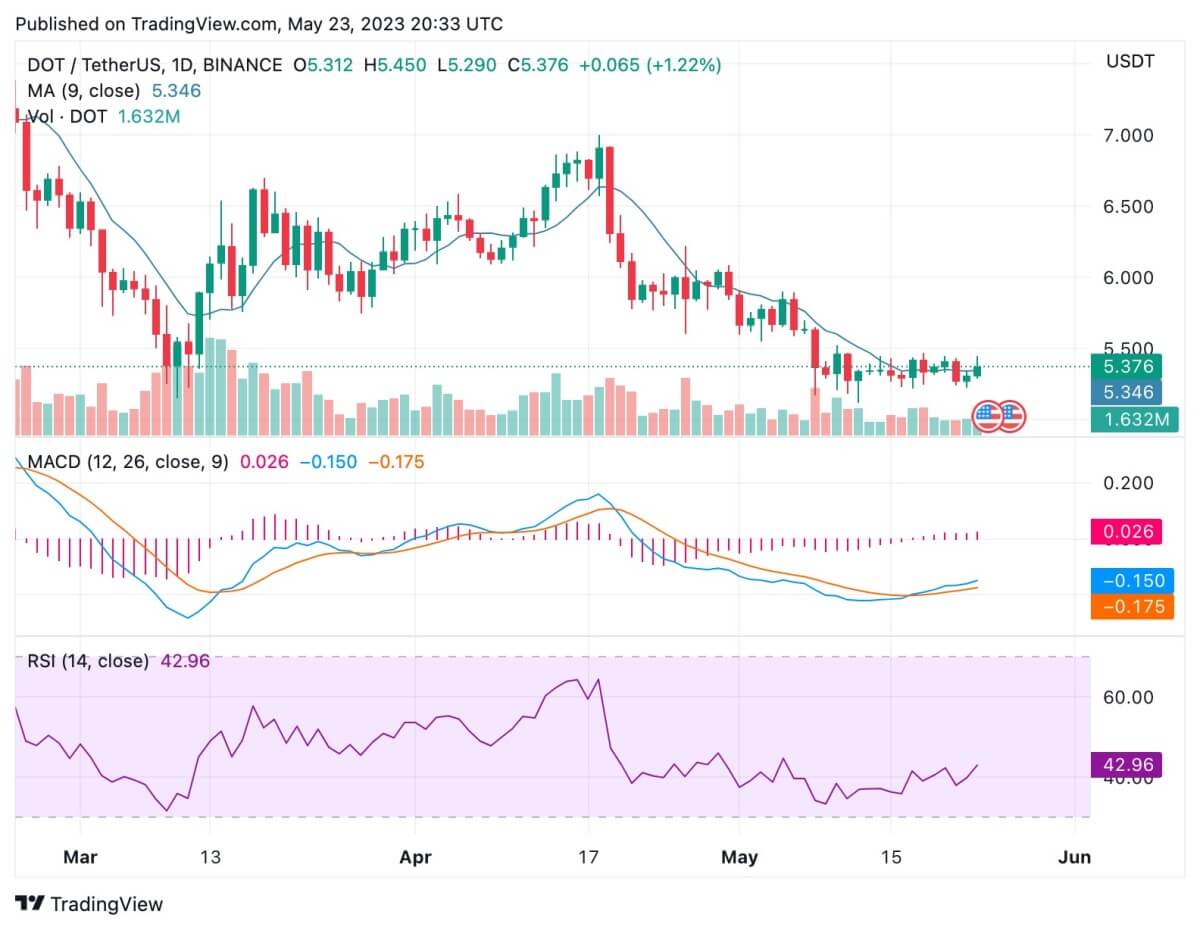
The 24-hour relative strength index (RSI) can be seen picking up around the 43 mark to show increasing market valuation for $DOT. As the RSI value reaches the 50 mark, price could hit an uptrend to pursue the $6 resistance. In addition, the moving average convergence divergence (MACD) curve also shows a bullish divergence taking place, with the trend line crossing above the signal line.