While the Injective (INJ) price has fallen since its yearly high in April. However, it shows signs that it will soon regain its footing.
The wave count and the long-term readings indicate that the upward movement will resume soon.
Injective Price Attempts to Resume Uptrend
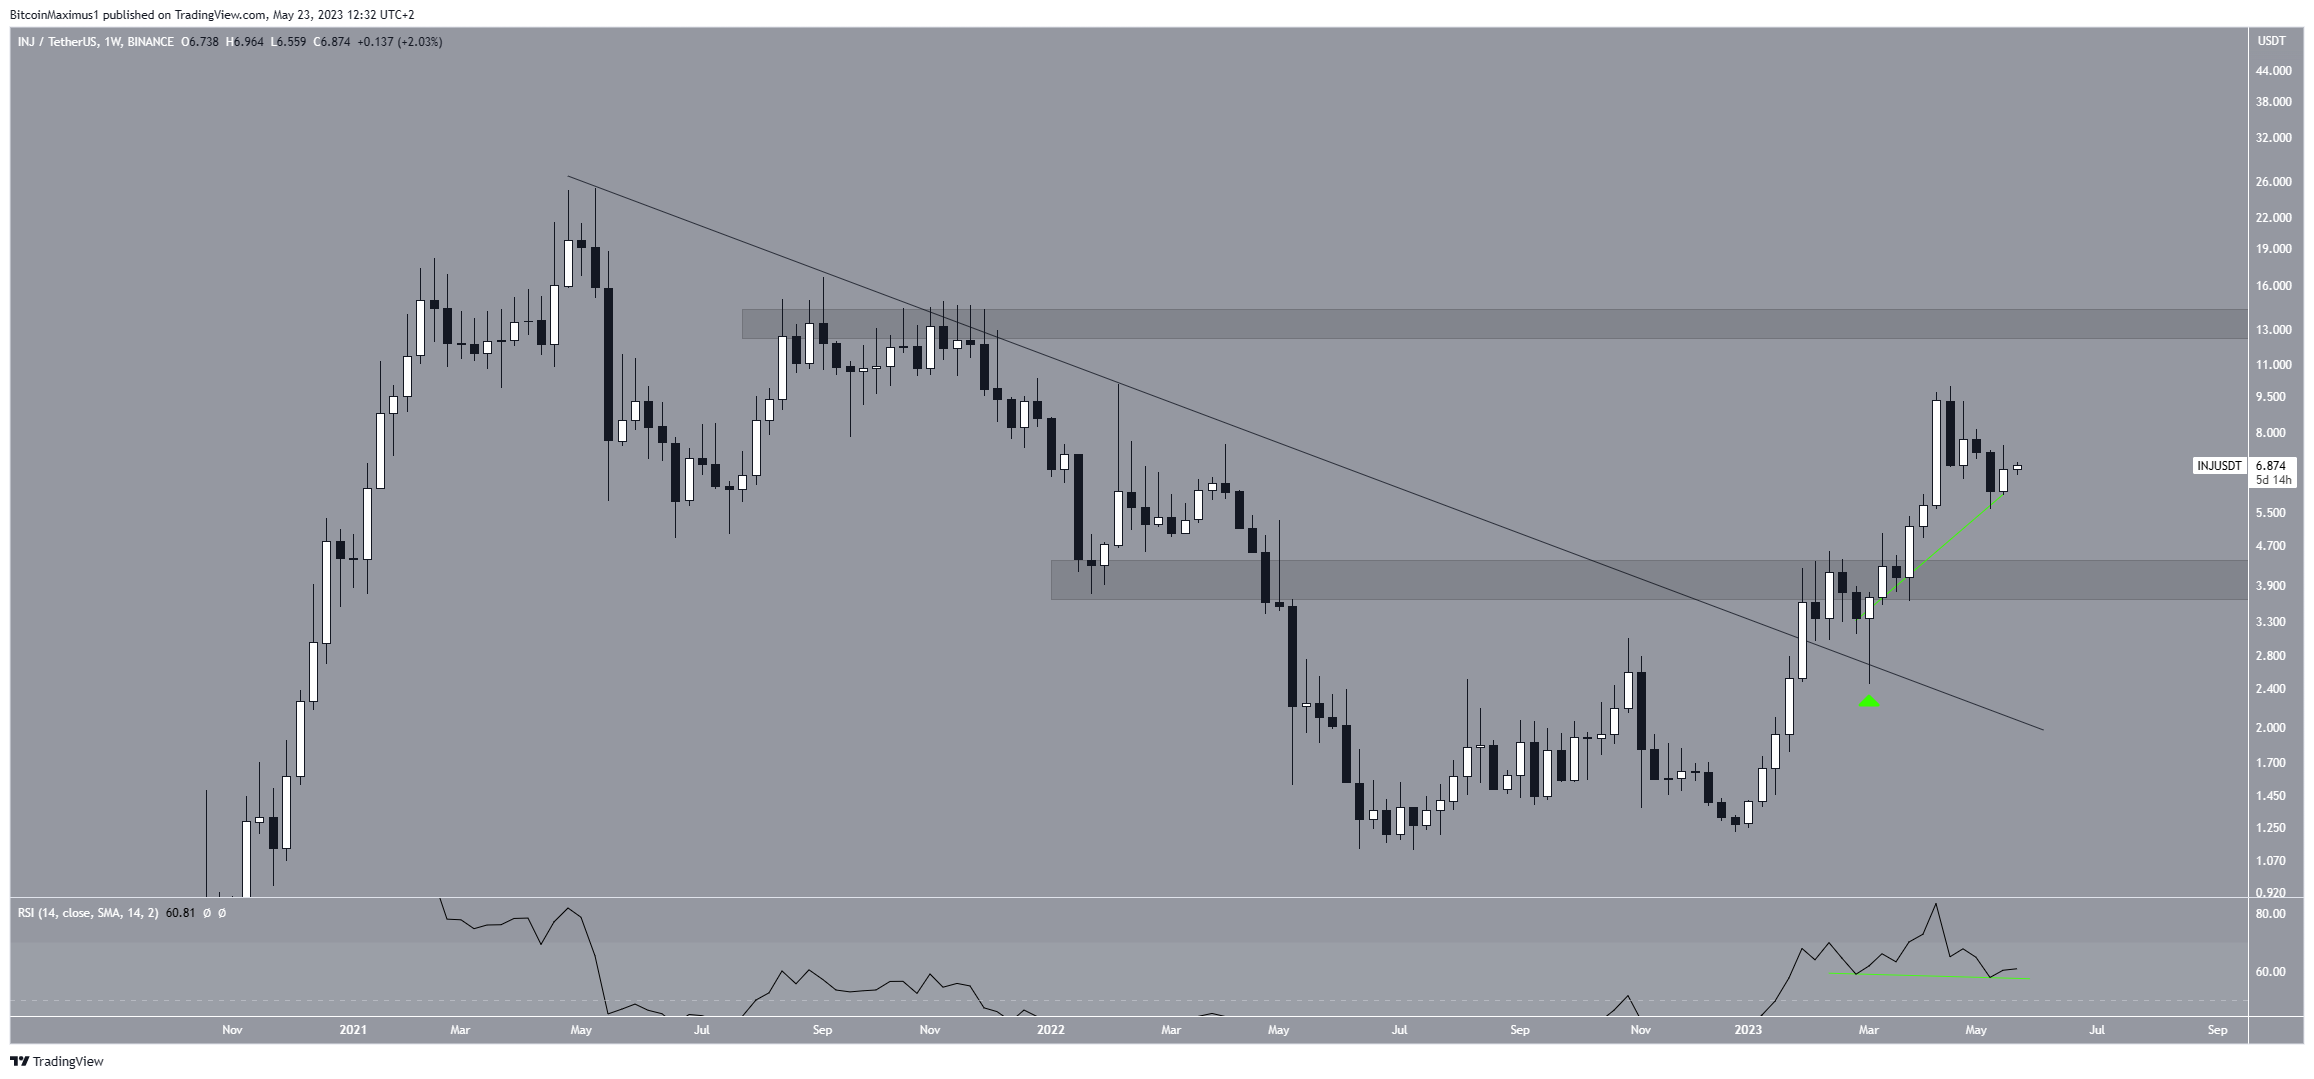
The INJ price has increased since the beginning of the year. In January, INJ cleared a long-term resistance that had been in place since the May 2021 all-time high. Breakouts from such long-term structures usually lead to significant increases.
After the breakout, the price validated the line as support in March (green icon) before further accelerating its rate of increase. This led to a new yearly high of $9.97 the next month. Despite the high, the price failed to reach the main resistance at $13.80 and fell afterward.

The weekly RSI supports the continuation of the increase. Market traders use the RSI as a momentum indicator to identify overbought or oversold conditions, and to decide whether to accumulate or sell an asset.
Readings above 50 and an upward trend indicate that bulls still have an advantage, whereas readings below 50 suggest the opposite. The indicator is above 50 and moving upwards. Additionally, it has generated a hidden bullish divergence, an occurrence that usually leads to a trend continuation.
INJ Price Prediction: Does Wave Count Support Increase?
The technical analysis from the daily time frame supports the continuing increase. The main reason for this is the wave count. The Elliott Wave theory, employed by technical analysts, involves the analysis of recurring long-term price patterns and investor psychology to determine the direction of a trend.
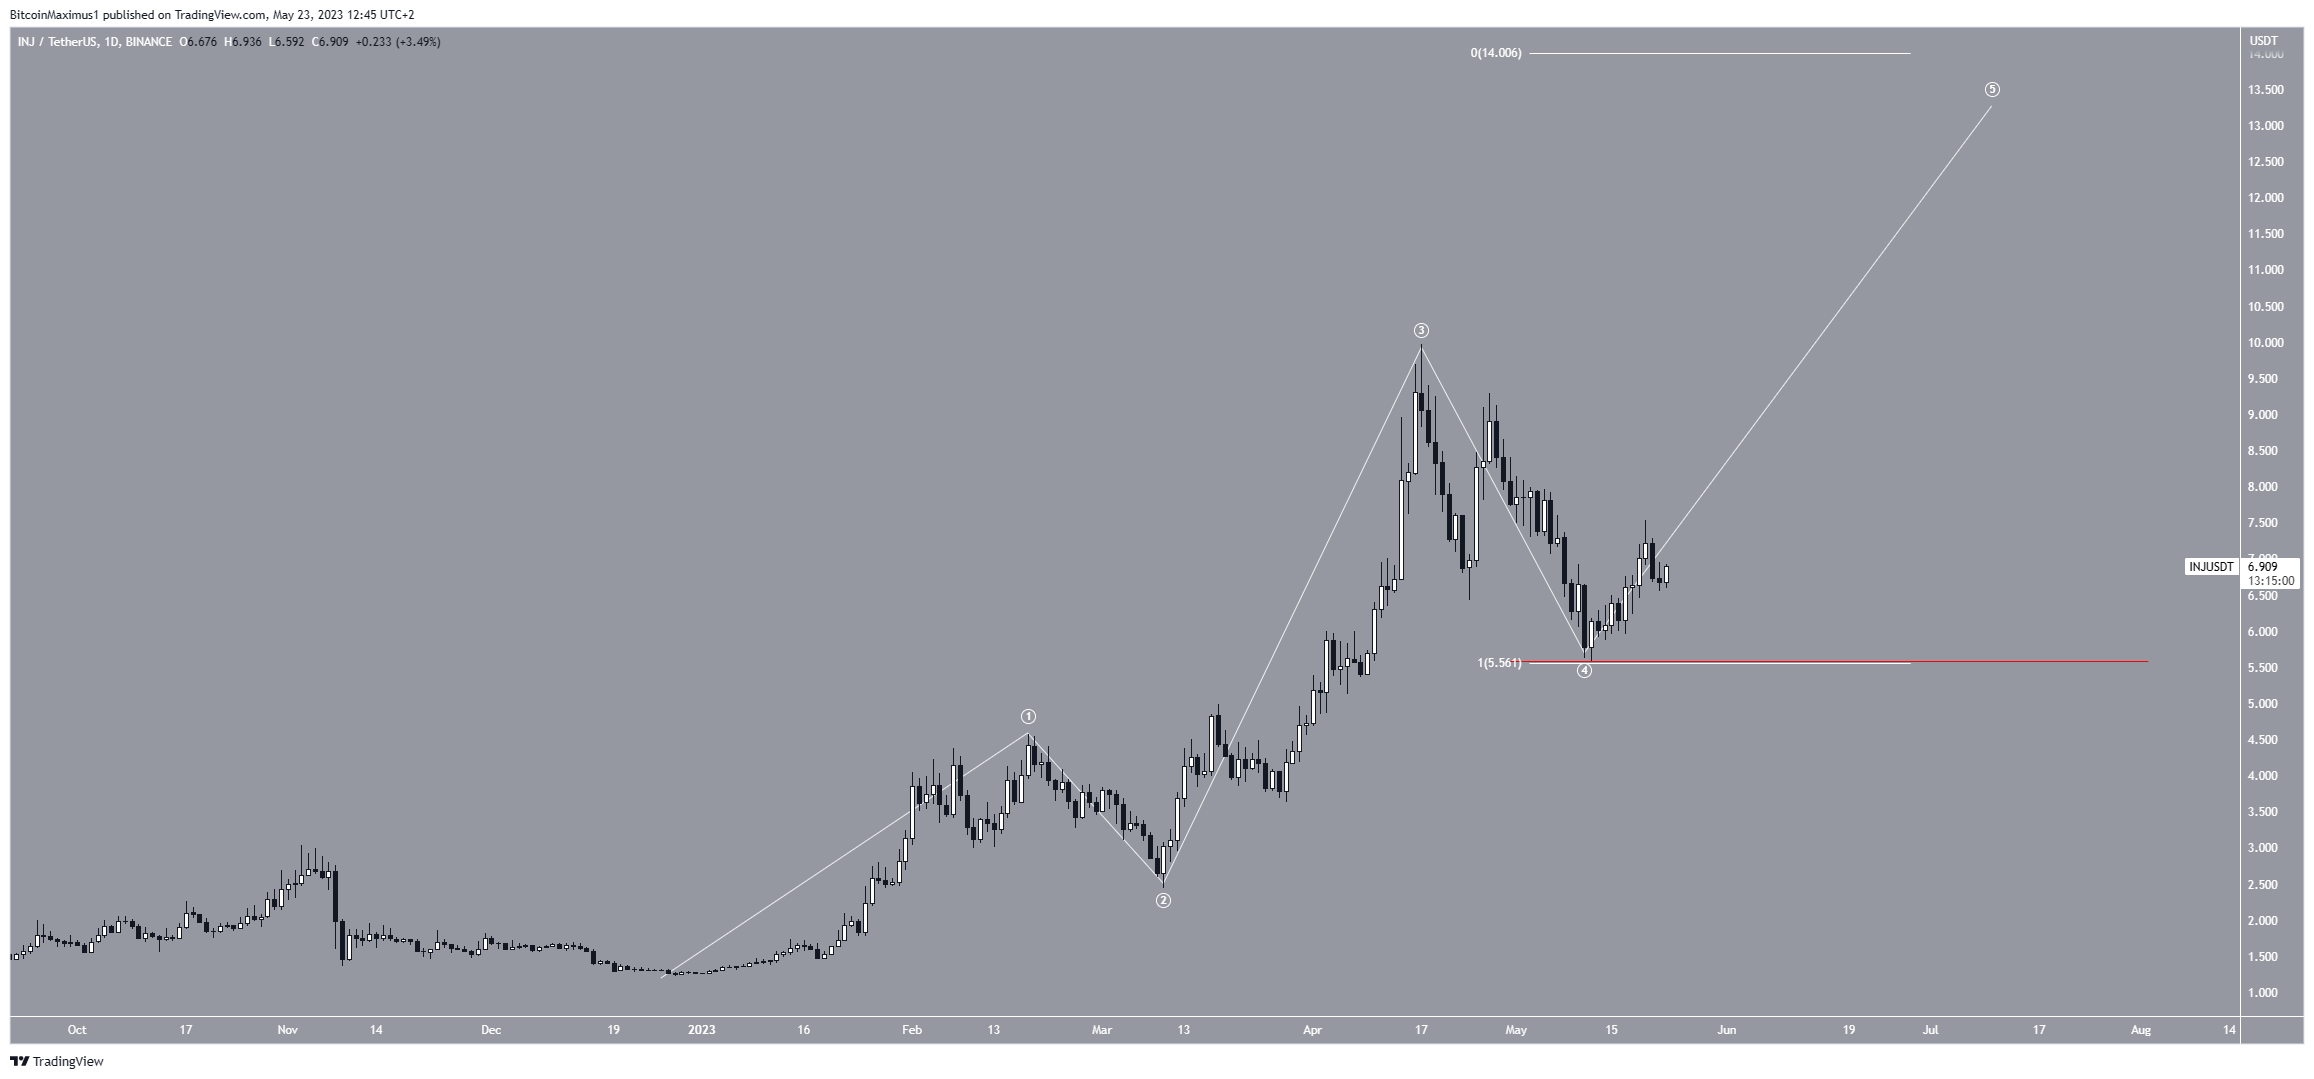
According to the count, the INJ price has completed wave four of a five-wave increase. If correct, it has now begun the fifth and final wave of the rise.
If the count is correct, the top’s most likely target would be $14. The target is found by projecting the length of waves one and three to the bottom of wave four. The target would also align with the previously outlined long-term resistance at $13.60.

Despite this bullish INJ price prediction, a decrease below the wave four low (red line) at $5.58 will mean that the trend is bearish.
In that case, the INJ price will likely fall to the next closest support at $4.
For BeInCrypto’s latest crypto market analysis, click here.
 beincrypto.com
