Polygon’s (MATIC) bullishness faded early when bulls failed to break above the 24-hour high of $0.9411. Due to the bulls’ hesitancy, MATIC’s price dropped to a 90-day low of $0.886 before regaining support. At press time, the MATIC market was dominated by bears, resulting in a 3.69% drop to $0.8945.
The market capitalization of MATIC fell 3.77% to $8,254,089,404, while the 24-hour trading volume increased 15.65% to $436,899,775.
This spike shows the possibility that traders are taking advantage of the heightened volatility by engaging in short-term trading tactics such as day trading or scalping. Increased volatility might entice more traders to the market since these tactics depend on frequent price fluctuations to produce gains.
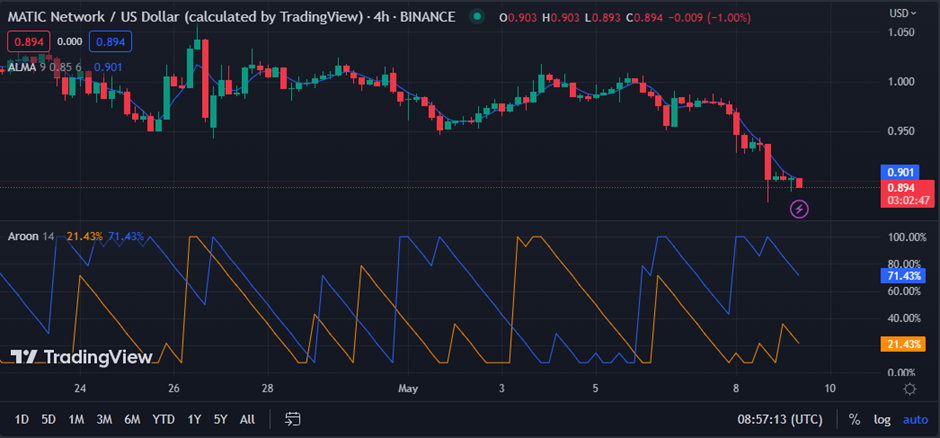
With a value of 0.902, the Arnaud Legoux Moving Average (ALMA) indicator rises above the price, supporting the bearish momentum. When the market price falls below the ALMA line, it is regarded as a bearish indication, suggesting that the price is decreasing due to selling pressure.
The negative momentum in the MATIC market is strong, with an Aroon down reading of 71.43% and an Aroon up reading of 21.43%. This movement implies more significant selling pressure and an impending decline.
Due to this change, traders may be trying to modify their holdings to capitalize on any short-term opportunities.
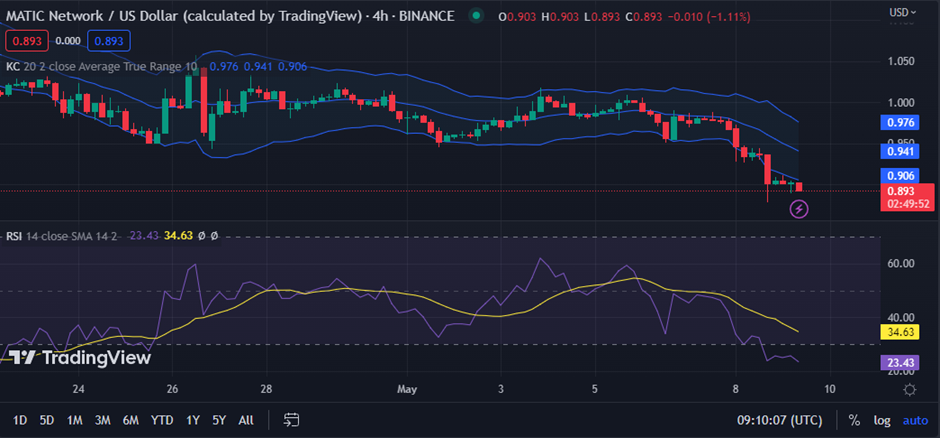
On the MATIC/USD 4-hour price chart, the Keltner Channel bands are moving south, with the upper, middle, and lower bands touching 0.976, 0.941, and 0.906. This movement of the bands indicates that the market is declining, that volatility is reducing, and that the price may be consolidating inside a narrower range.
However, the fact that the price has reached the lower range shows that the market is oversold, which means that the price is below its fair value and might be ready for an upward reversal.
The Relative Strength Index (RSI) of 23.63 indicates that the market is now oversold. This movement suggests a possible purchasing opportunity for traders trying to capitalize on the market’s oversold circumstances.
In conclusion, the MATIC market is bearish with increased volatility, offering short-term trading opportunities. Traders may look for potential buying opportunities as the oversold conditions suggest a potential upward reversal.
Disclaimer: The views, opinions, and information shared in this price prediction are published in good faith. Readers must do their research and due diligence. Any action taken by the reader is strictly at their own risk. Coin Edition and its affiliates will not be liable for direct or indirect damage or loss.