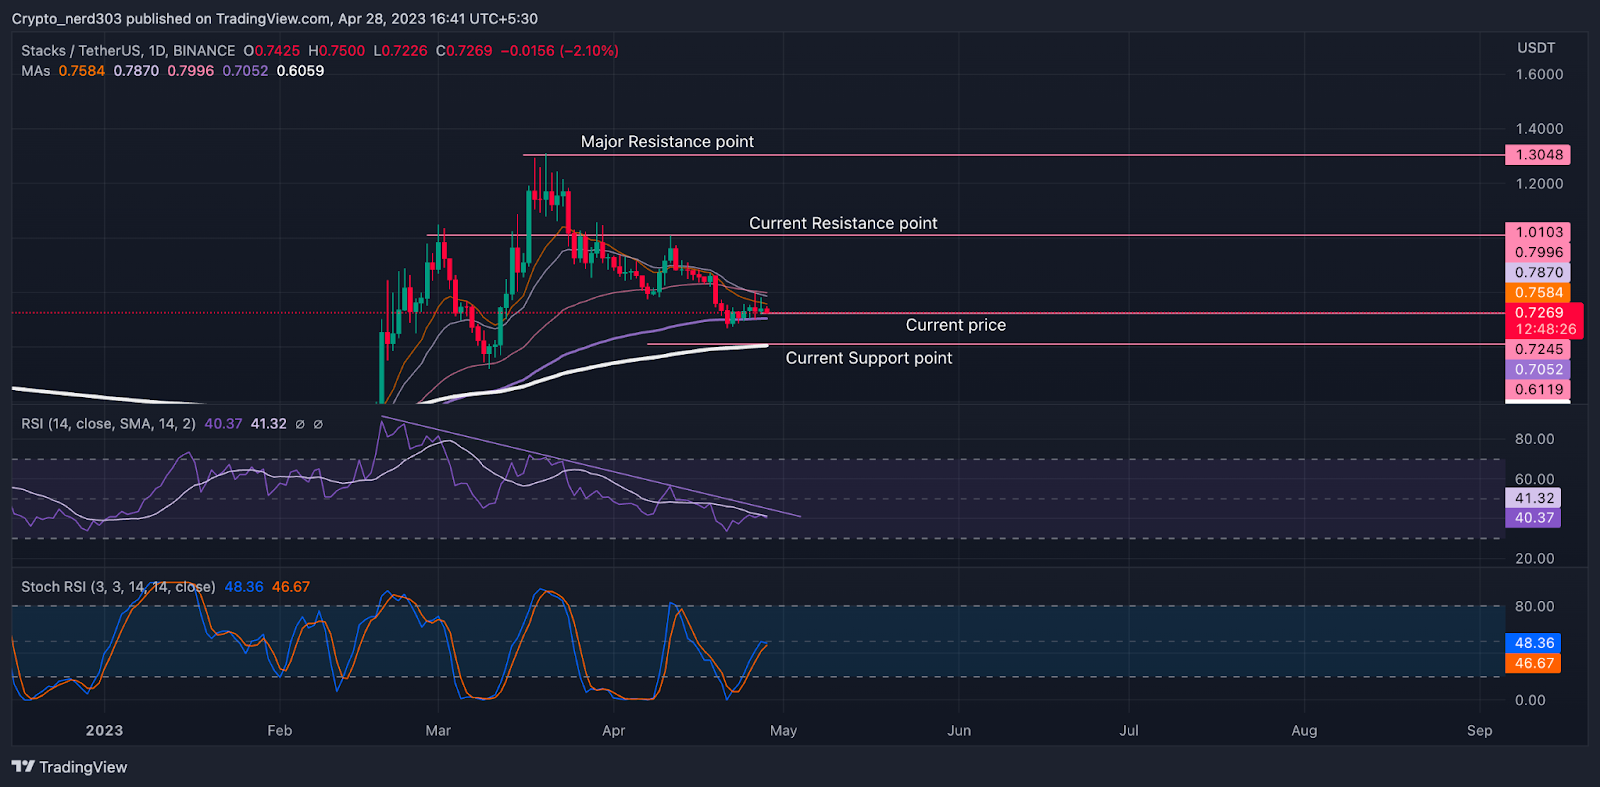
- The STX price is currently trading at $0.7269 while seeing a change of -48% in 24-hour trading volume.
- The STX price is observing a decline of -2.90% in the last 24 hours.
The price of STX is currently trading on a bull trend above the major key EMA’s. Previously after the breakout, the price started trading on an uptrend; taking consistent support from the 50 EMA.
Recently near mid-April, the price made one more attempt to take support from 50 EMA to continue its bullish trend. Though the price abruptly changed its trend after taking resistance from $1.0500 and breaking its nearest support 50 EMA. At present the price is consolidating above the 100 EMA.
The STX price will require fierce buyer support to sustain the bull trend. If it gains the investor’s support it can gain 40 to 80% of its value back.
STX price Taking a Reversal From The 100 EMA on (Daily Timeframe)

Near mid-February, the STX price started trading within a narrow convergence giving small movements. After giving a bullish golden crossover above the 200 EMA it made an extremely bullish rally of more than 80%.
At present the price is providing indications of making a similar move if the investors support the price.
Technical Analysis ( 1 Day Timeframe )

The price of STX is taking support from the 100 MA and EMA. This is an extremely bullish indication as the price is gaining support from both the Exponential Moving average and Simple Moving average.
As of now, the STX price is making a higher high and higher low pattern consolidating near the demand zone on the daily timeframe. Alternatively, the 20 EMA is indicating a bullish crossover.
The STX price is currently taking support from the 100 MA and EMA. The current support levels for the STX price are around $0.7000 and its major support level is at $0.6000. The resistance point for the price of STX is near $1.000 and its major resistance is at $1.200.
The RSI line is taking a divergence from the price action. The value of the RSI line as of now is 40.37 points, while the 14 SMA is providing support at 56.21 points.
Conclusion
Presently the price action is indicating at it may take a bullish reversal. If the price takes support from the current level, it can make a bullish rally of 40%. While its nearest support is 14% below the current price level at $0.6000. The price is offering a good risk and reward ratio for interested buyers.
Technical levels –
Support – $0.7000 and $0.6000
Resistance – $1.000 and $1.200
Disclaimer
The views and opinions stated by the author, or any people named in this article, are for informational purposes only, and they do not establish financial, investment, or other advice. Investing in or trading crypto assets comes with a risk of financial loss.
 thecoinrepublic.com