
Casper’s (CSPR) bullish momentum has been strong in the previous 24 hours, with bulls moving prices from a support zone of $0.05176 to an intra-week high of $0.05754 before encountering resistance. Despite this obstacle, CSPR bulls remained in command, leading a 1.03% increase to $0.0541 as of press time.
During this bullish rise, CSPR’s market capitalization and 24-hour trading volume increased by 1.03% and 92.50%, respectively, to $592,973,363 and $22,612,957.
If bullish momentum breaks beyond the 7-day high of $0.05754, the following psychological mark for traders and investors to take gains or open new positions might be near $0.06.
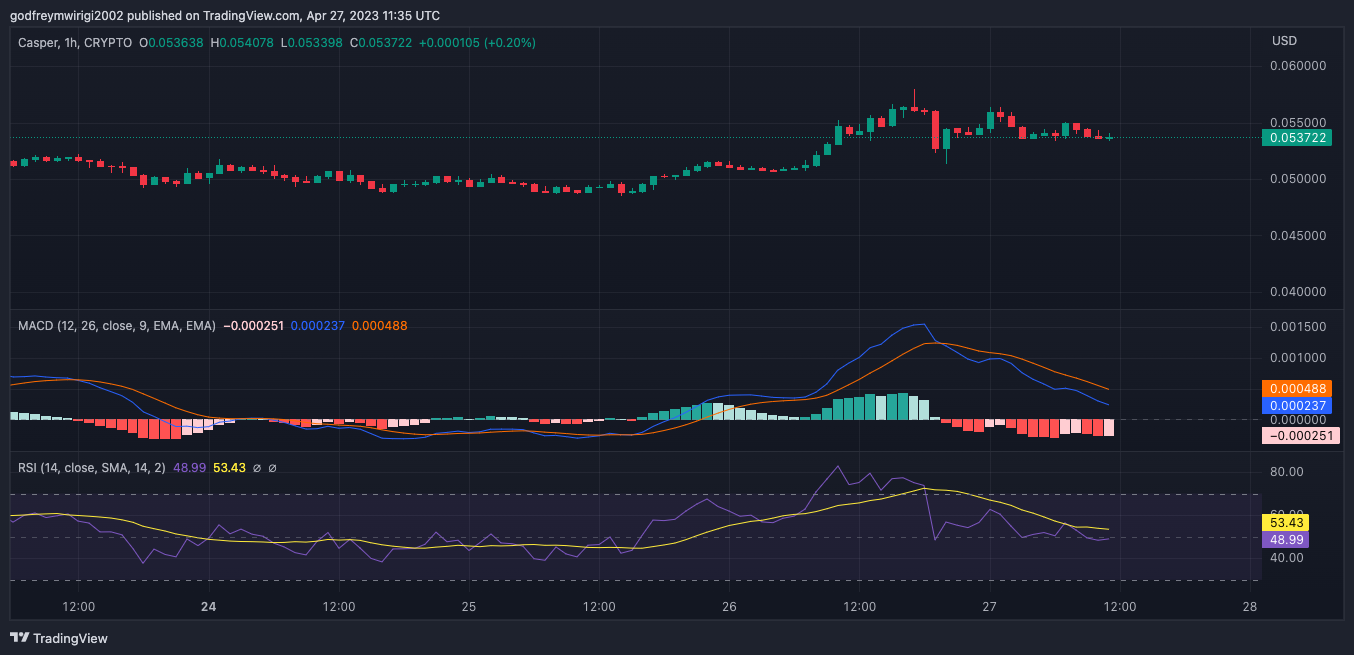
Despite being bullish, the MACD line moved in the negative zone with a value of 0.000333, indicating that CSPR’s bullish momentum may diminish. A bearish crossing may occur if the MACD line continues to move downwards toward the signal line.
The histogram’s negative trajectory further supports the prospect of a bearish crossing and signals a likely trend reversal in CSPR’s price movement.
The Relative Strength Index reading of 49.90 and falling below its signal line reflect the market’s negative mood, indicating that investors may be selling off their holdings in CSPR. This level, however, is still over the oversold threshold of 30, suggesting that the stock may have some support at its present price and that the upward trend may continue.
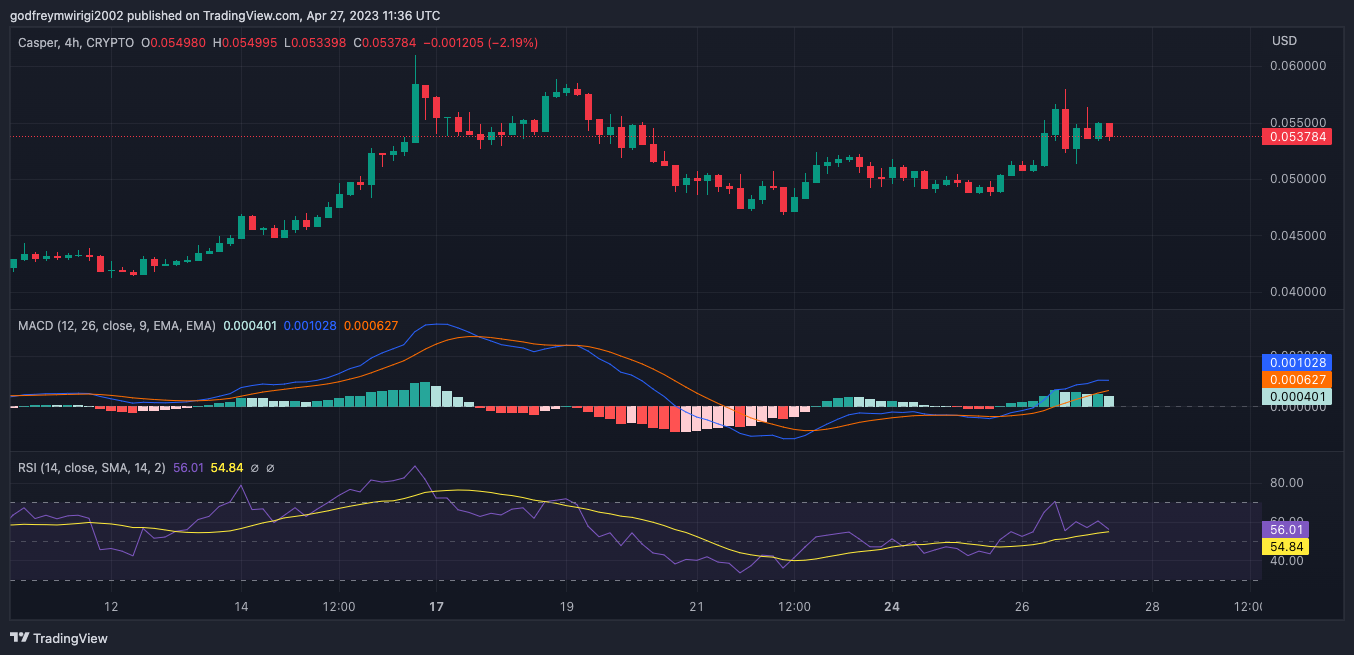
However, on the 4-hour price chart, the MACD line advances above its SMA line, indicating that the negative momentum seen on the CSPR 1-hour price chart may be losing steam, and the price may continue to rise short term.
With a value of 0.000408, the histogram indicates that bullish momentum is growing as the MACD line moves farther away from the signal line. Despite this movement, traders should watch volume and price activity to confirm the likely continuation of the positive trend.
The RSI reading on the CSPR/USD 4-hour price chart is 55.43, indicating that the market is now neutral but may become bullish if the RSI climbs over 60 and the price breaks above the resistance level at $0.05754.
In conclusion, CSPR’s bullish momentum shows signs of a potential reversal, but traders can take advantage of short-term gains with careful monitoring.
Disclaimer: The views, opinions, and information shared in this price prediction are published in good faith. Readers must do their research and due diligence. Any action taken by the reader is strictly at their own risk. Coin Edition and its affiliates will not be liable for direct or indirect damage or loss.