
The ICON (ICX) helps two independent blockchains Bitcoin and Ethereum connect and transact with each other. It can function like this by opening up the cross-chain with an interoperability layer which is ICON. The token, ICX, is powered by a loop chain, which is a blockchain engine designed by ICONLOOP. Let us look at the technical analysis of ICX.
Past Performance
In the past seven days, ICX has traded between $1.64 and $2.17, that is, between September 27, 2021, and October 03, 2021. Thus, in the past week, ICX has increased by approximately 32.09%. In the last 24 hours, ICX has traded between $2.05-$2.36.
https://www.tradingview.com/x/WY2aAlbh/
ICX Technical Analysis
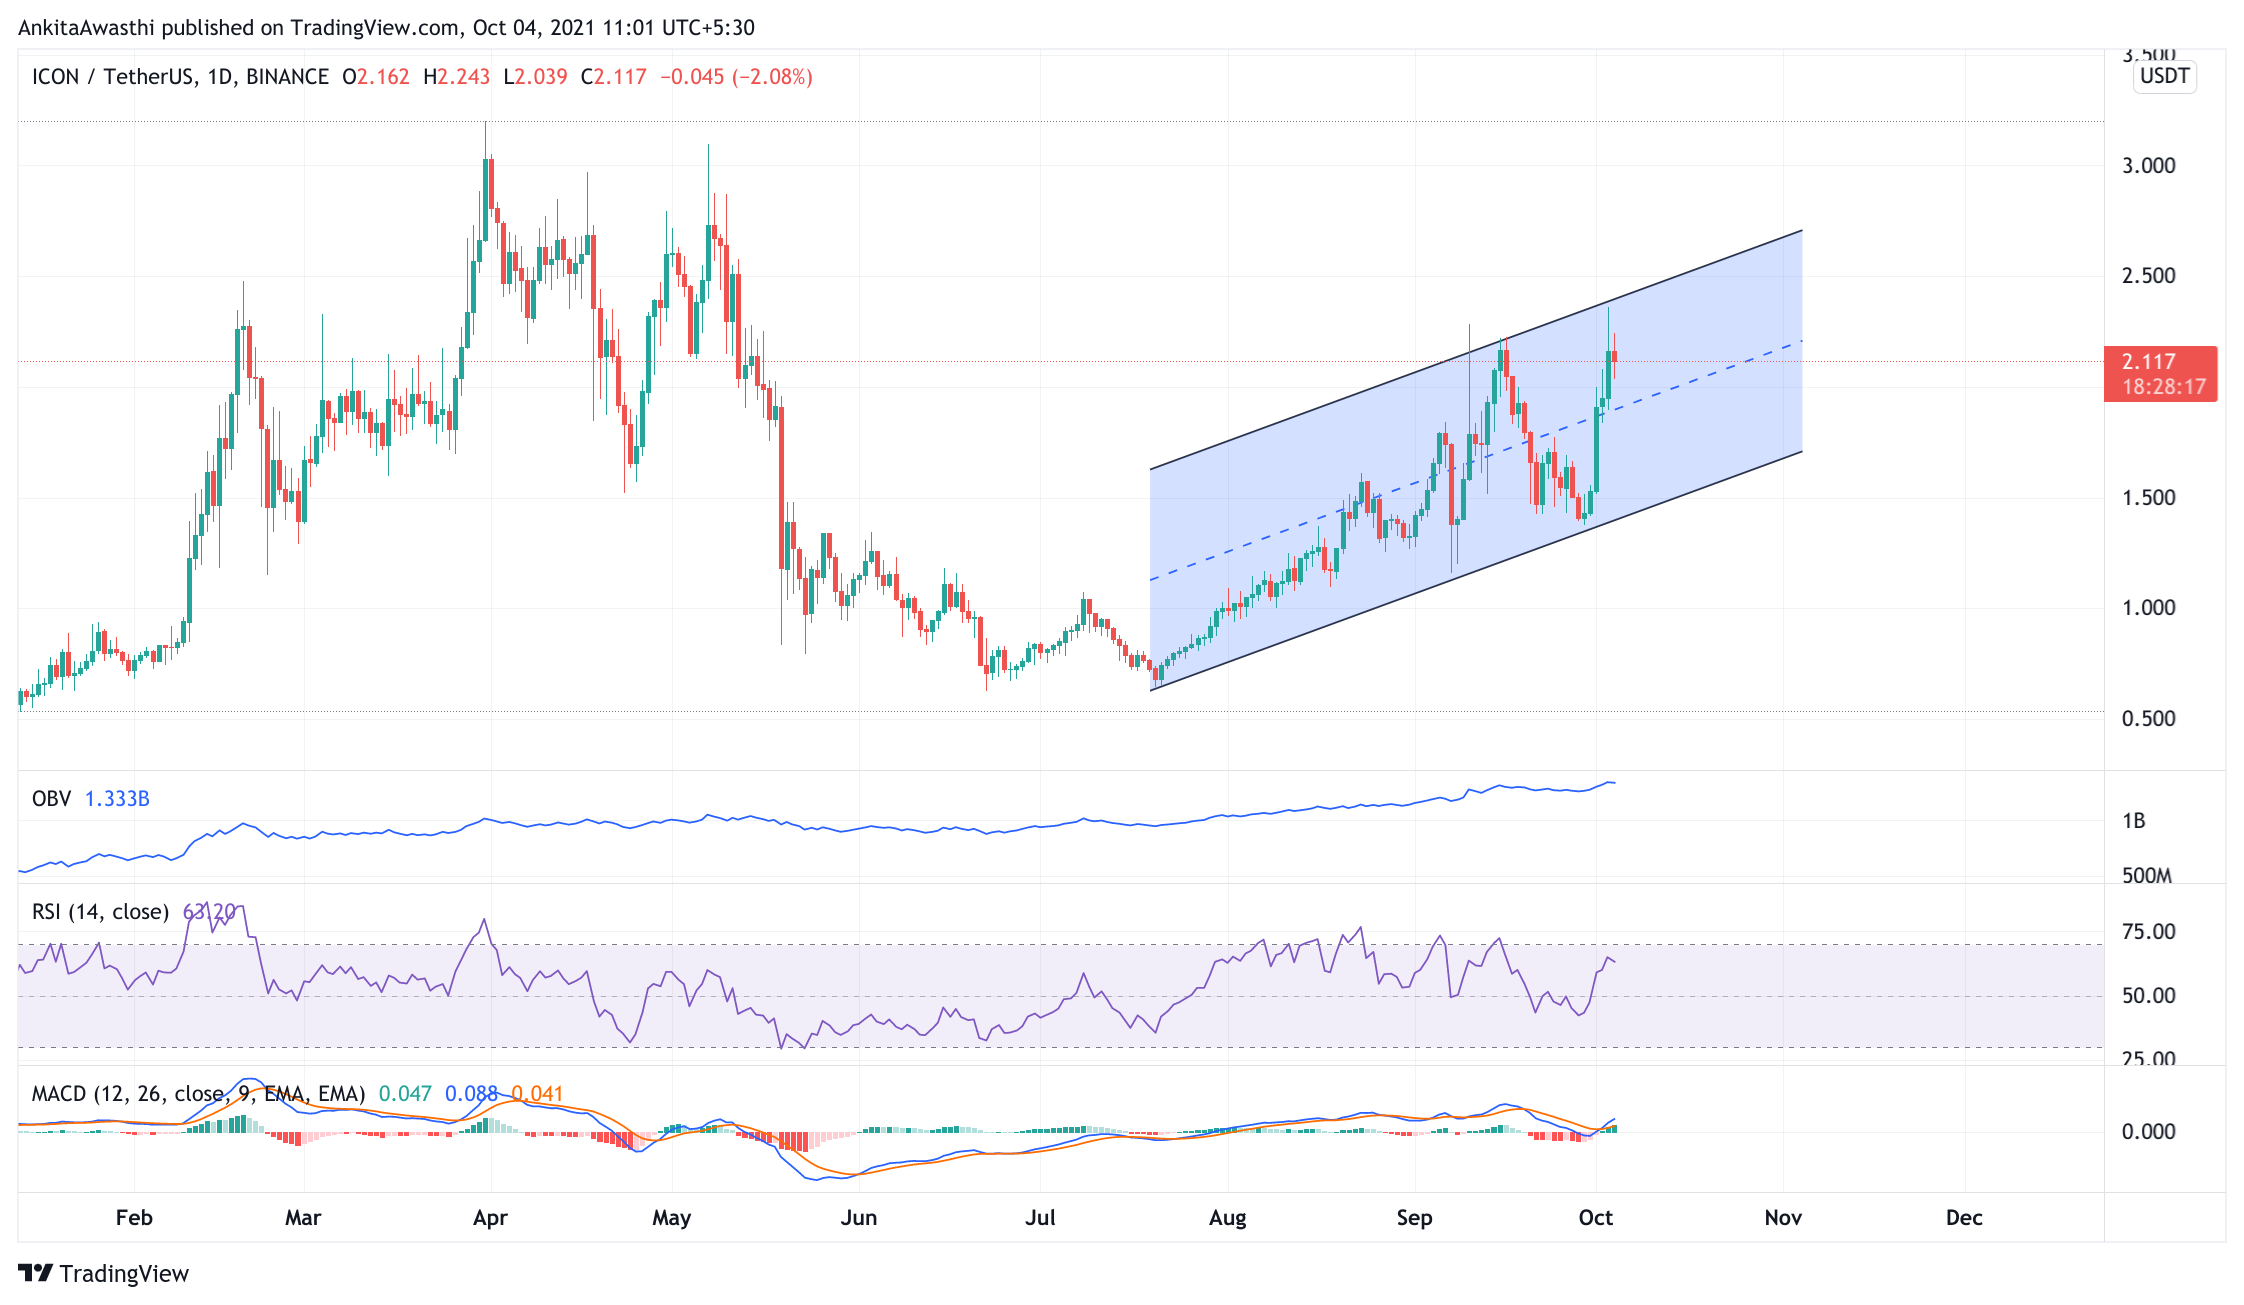
The price has broken out of its six-month-long resistance level. After the 19th may crypto crash the price has been in a consolidating stage. It has consolidated for almost around six months, and the 24-hour candle has given a clear breakout of that range. However, the price might cool off and retest the breakout level. Let’s see what the indicators are indicating;
At the time of press, ICX was trading at $2.12. The price has decreased by approximately, 7%, in the last 24 hours. Moreover, the price is currently trading above the center of a breakout of its parallel channel. It has broken out from its resistance level of $1.82. Now, we can expect the price to make new highs. Although, the price might retest the breakout level.
The MACD and signal lines are in the positive zone. Moreover, a bullish crossover by the signal line over the MACD line has occurred. Thus, we can witness that the overall market momentum is bullish and we can expect a surge in price.
However, the MACD and the Signal line are near the zero range. Thus, the trend reversal could be on the horizon.
Also, we can see that the RSI indicator is making bullish divergence. It is currently at the 63% mark. RSI has resisted from the 68% mark and is currently in a downtrend. A cool-off in the RSI can lead the price to fall for the rest of the day. However, RSI has strong support near the 49% mark. A breakdown from this level on the daily chart will confirm the downtrend.
The On balance volume has broken its downtrend and has started moving towards an upward directory.
In short, when we look at oscillators, we can say that the price may continue to rise. However, we cannot rule out the possibility of a trend reversal. We have to wait and watch to see if an intermittent price rise is a corrective action or the beginning of a positive trend.
Day Ahead And Tomorrow
Currently, it is trading above the Fibonacci pivot point of $1.94. As some of the oscillators have shown bullish signals, we can expect the price to increase and test the Fibonacci pivot resistance level of $2.28 soon.
However, the price has tested and fallen after resisting from the FIB level of $2.22. If the price falls below the FIB extension level of $1.94 in some time, this implies that the price downtrend is strong. In that case, the price downswing is likely to continue tomorrow as well.