- XMR price is currently trading at $158.00 with an increase of 2.6% in the 24-hour trading volume.
- XMR price recorded a decline of 0.14% in the last 24 hours.
- XMR price is expected to make a bullish move in the near future
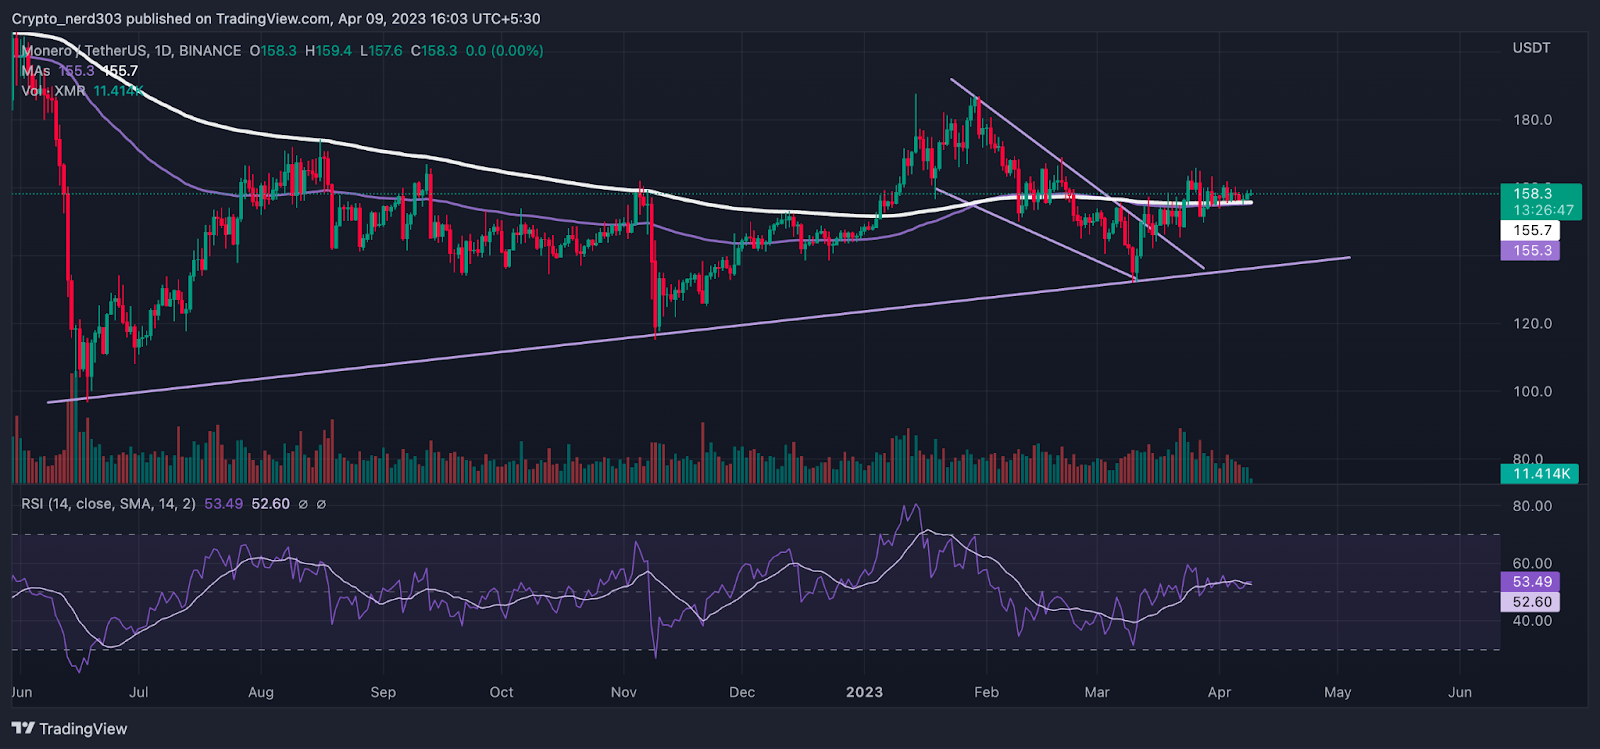
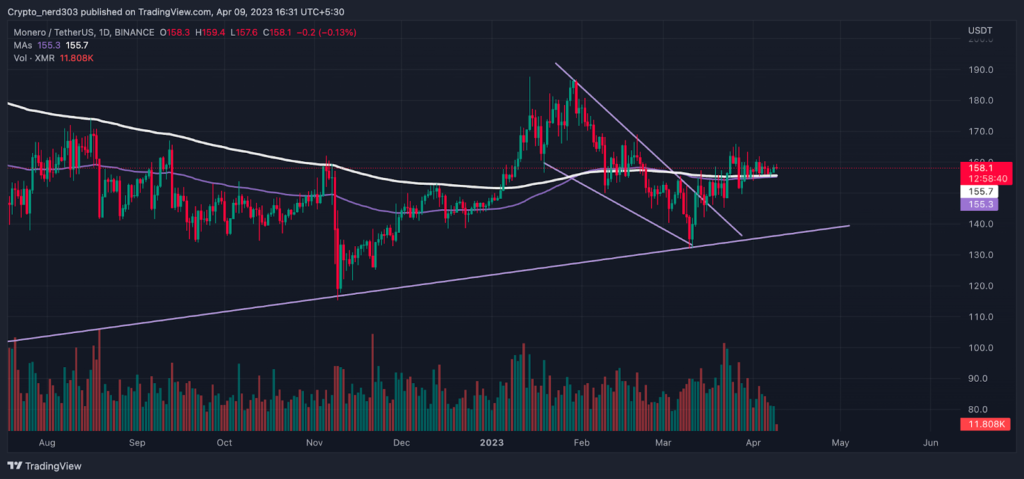
XMR price is currently trading above the 200 day EMA. After making consistent attempts to cross above its major resistance level by the XMR price, it finally crossed above it with a strong bullish candle. As of now, the sellers are making an attempt to take control of the price action. But the buyers are persistent and they are maintaining their stronghold above the 200 EMA.
The price is trading in an overall bullish trend. The consolidation-like pattern before and after crossing the 200 EMA shows the struggle between the buyers and sellers. Before crossing the resistance point, the sellers had a strong chance to maintain their control as the 200 EMA is a strong resistance point but as of now, the buyers have a better chance of continuing the bull trend.
XMR Price Under a Consolidation Above 200 EMA on the (1-Day Timeframe)

XMR made a bullish attempt previously to break above the 200 EMA with a strong move but it was not able to sustain above the level. Monero’s price made an attempt after taking support from its major support level of around $132.0, following which XMR coin broke the wedge pattern by giving a strong bullish piercing candlestick pattern.
XMR coin, after breaking the wedge pattern, started trading under a narrow consolidation pattern. Previously, our analysts predicted that Monero price trading just below the 200-day EMA suggests that the coin is being accumulated and it was estimated that the price could produce a breakout above the 200-day EMA.
Technical Analysis (1-Day Timeframe )

As of now, Monero price is trading just above the 200 EMA and 100 EMA in a consolidation phase. The price needs major buyers’ support at this level to break out. On the other hand, though the bulls have leverage they are not out of the danger zone just yet.
Conclusion
The actual bull trend will begin when the price either breaks out of this level with extremely bullish momentum, or if the price makes a breakout with a retest. The retest phase holds importance because most of the intelligent investors wait for a confirmation of the price action before making a move. The stochastic RSI and RSI are supporting these bullish sentiments in the price action.
Technical levels –
Support -$155.3
Resistance – $190.0
Disclaimer
The views and opinions stated by the author, or any people named in this article, are for informational purposes only, and they do not establish financial, investment, or other advice. Investing in or trading crypto assets comes with a risk of financial loss.
 thecoinrepublic.com
