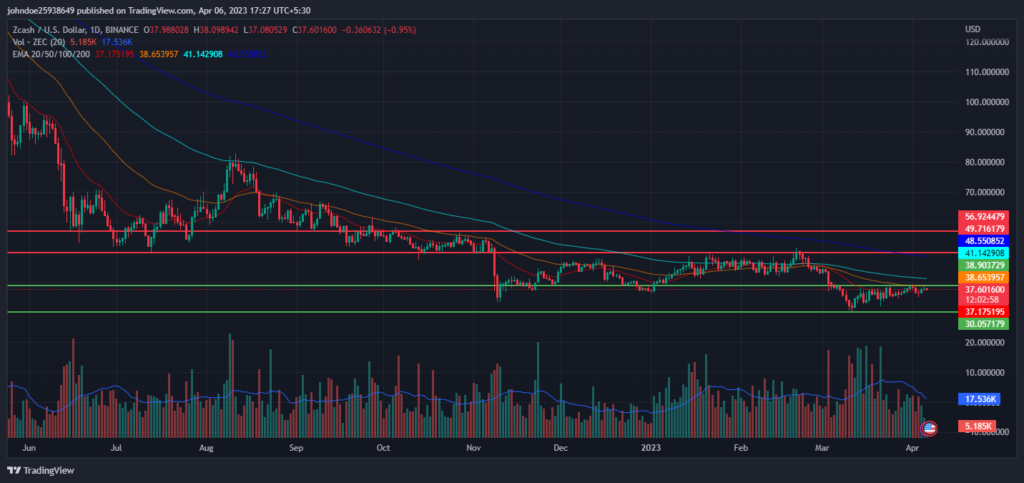
- 1 Zcash is currently trading at $37.52 (press time) with a decrease of 2.07% intraday.
- 2 The 24-hour low for $ZEC was $37.17 and the 24-hour high was $38.54.
- 3 The current Zcash price is below the 20-, 50-, 100-, and 200-Day EMAs.
The $ZEC/$BTC pair was trading at 0.001345 $BTC during intraday trade, representing a slight gain of 0.18%. The $ZEC token, however, experienced a huge fall of 80.29% in the prior year, showing a major effect from sellers. Due to strong selling pressure in the market, the $ZEC token was hovering around its primary support level of $38.903 at 2022-end.
However, from the beginning of 2023, the $ZEC price began to gradually increase thanks to strong market support from buyers. But the $ZEC price was rejected after testing the main barrier of $49.716, losing its upward impetus. As seen on the daily time frame chart, this might have led to a previous downtrend. The short-term uptrend may have started as a result of the morning star candlestick pattern that had formed after the downturn.
Zcash price prediction suggests if buyers push themselves and help the $ZEC price in breaking through the primary support, then the token may show an upward rally over the daily time frame chart.

The trading volume of the coin increased by 7.72% in the last 24 hours, meaning that buyers in the market have increased. Buyers are trying their best and there is no relationship between the volume and the price of $ZEC, which shows weakness in the current bearish phase.
Zcash Price Technical Analysis

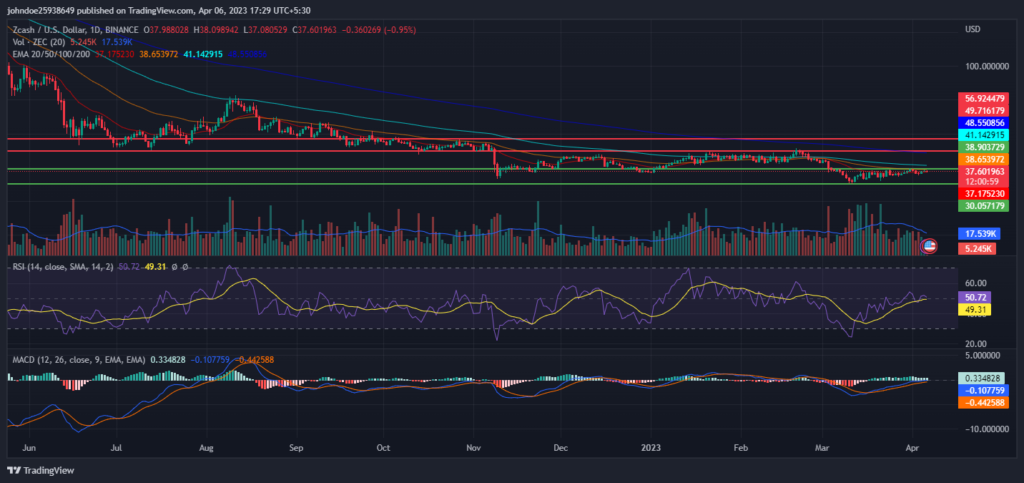
The Relative Strength Index (RSI) is decreasing in the overbought zone and might show a negative crossover over the daily time frame chart, wherein the sellers are in the majority and pushing $ZEC downwards. This shows the strength of the current bearish trend. The current value of RSI is 50.69, which is above the average RSI value of 49.30.
The MACD and the signal line are stranded near zero which shows neutrality in the market on the daily chart.
Conclusion
Zcash price prediction suggests $ZEC’s daily chart may witness an upward rebound if buyers successfully breach the main support. The sudden increase in the trading volume shows positive market sentiment toward the $ZEC token.
RSI is decreasing and might show a negative crossover over the daily trading chart which shows strength in the current bearish trend. MACD and the signal line are stranded near zero, highlighting market neutrality.
Technical Levels
Resistance level- $49.716 and $56.924
Support level- $38.903 and $30.057
 thecoinrepublic.com
