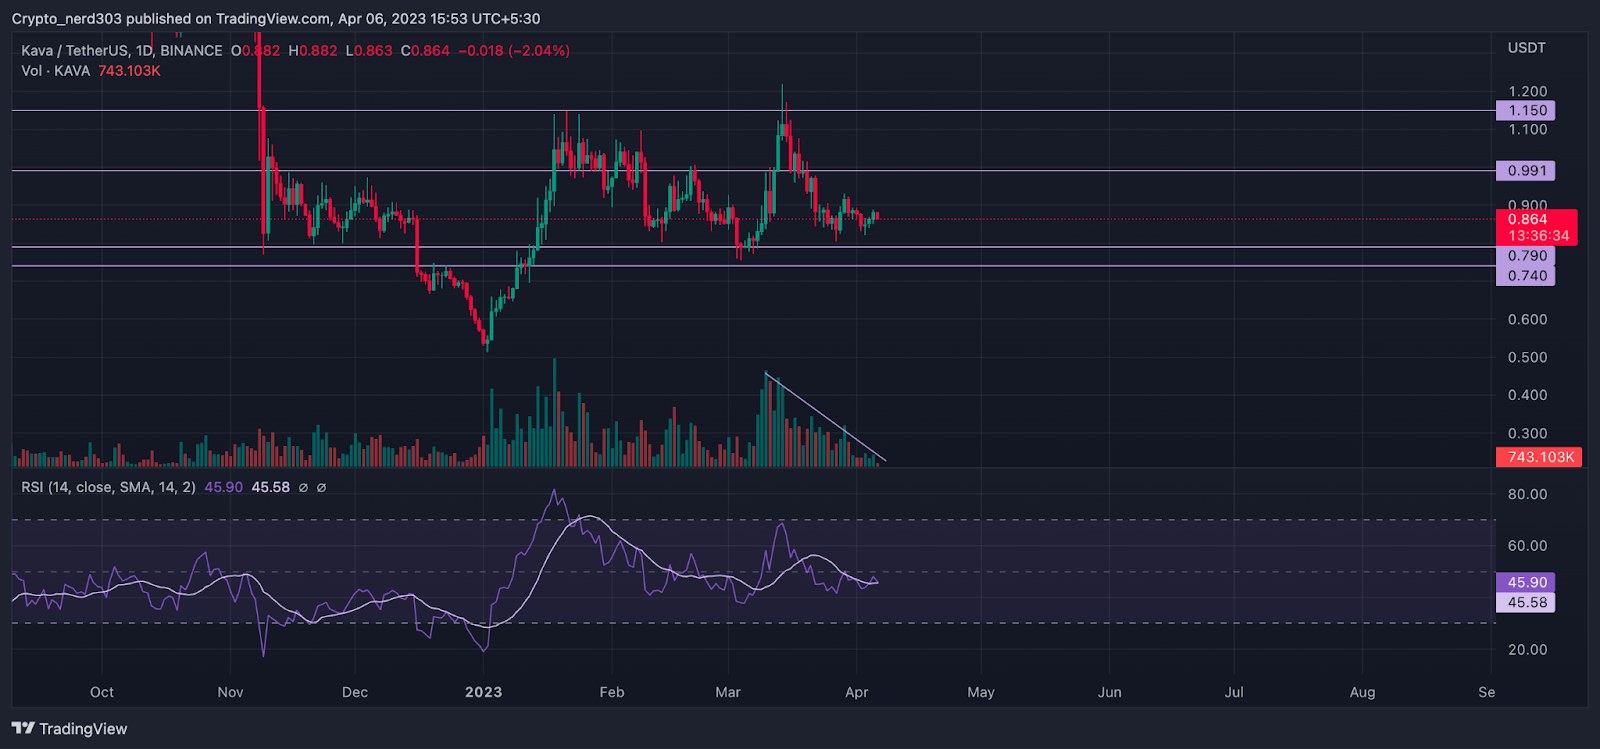
- 1 KAVA price is currently trading at $0.863 with an increase of 9.88% in the 24-hour trading volume.
- 2 KAVA price registered a decline of 2.51% in the last 24 hours.
KAVA coin price is currently moving sideways. The buyer’s sentiments regarding the KAVA price are bullish as can be observed by the volumes. The green candles are more prominent in the volume than red candles which in comparison are smaller. There is also a sudden decline in it which suggests that a breakout might occur in the near future.
The price is currently trading just above its recent 52-week low. It is moving in a sideways range which indicates that both the bulls and the bears are struggling to take control of the market. Although it is trading under the 200 EMA hence it can be estimated that the overall trend of the KAVA price is bearish. However, the price is gaining consistent support from the buyers from the $0.800 level which indicates that the investors are showing interest in the price and it may make a breakout if it gets strong support from them.
KAVA price trading at demand zone on the (Daily Timeframe)

The KAVA is a layer-one blockchain. It combines features of both the speed and ability to communicate in an effective way of Cosmos with the developer’s power of Ethereum. The KAVA platform includes an EVM-compatible execution platform environment with the help of which the developers and their Dapps may benefit from the scalability and security of the overall KAVA network. The KAVA network offers scalability, whereas with Tendermint consensus it can support the transaction needs of thousands of protocols.
Technical Analysis ( 1 Day Timeframe )
The KAVA network price is trading below the 200 EMA under the bear’s control. The KAVA price is currently facing severe resistance from the 20 EMA which has recently given a bearish crossover below the 50 EMA. All the slower-moving averages 20/50/100 and EMA’s are making a convergence. The RSI line has recently crossed below the 14 SMA and it is currently taking resistance from the median line. The present value of the RSI line is 45.43 points which is taking resistance from the median line moving at 45.54 points.
Conclusion
The overall price action of KAVA is giving bullish indications where the price is trading in the demand zone and according to historical price action, the price has taken support from these levels multiple times. However, the technical indicators are suggesting that the price has a few more barriers to cross before making a bull trend. If the price gets successful support from the buyers from these levels it can make a bullish rally of 38 percent.
Technical levels –
Support – $0.800
Resistance – $1.160
Disclaimer
The views and opinions stated by the author, or any people named in this article, are for informational purposes only, and they do not establish financial, investment, or other advice. Investing in or trading crypto assets comes with a risk of financial loss.
 thecoinrepublic.com
