The Algorand (ALGO) price is trading at an important confluence of resistance levels. Whether it breaks out or gets rejected could determine the future long-term trend.
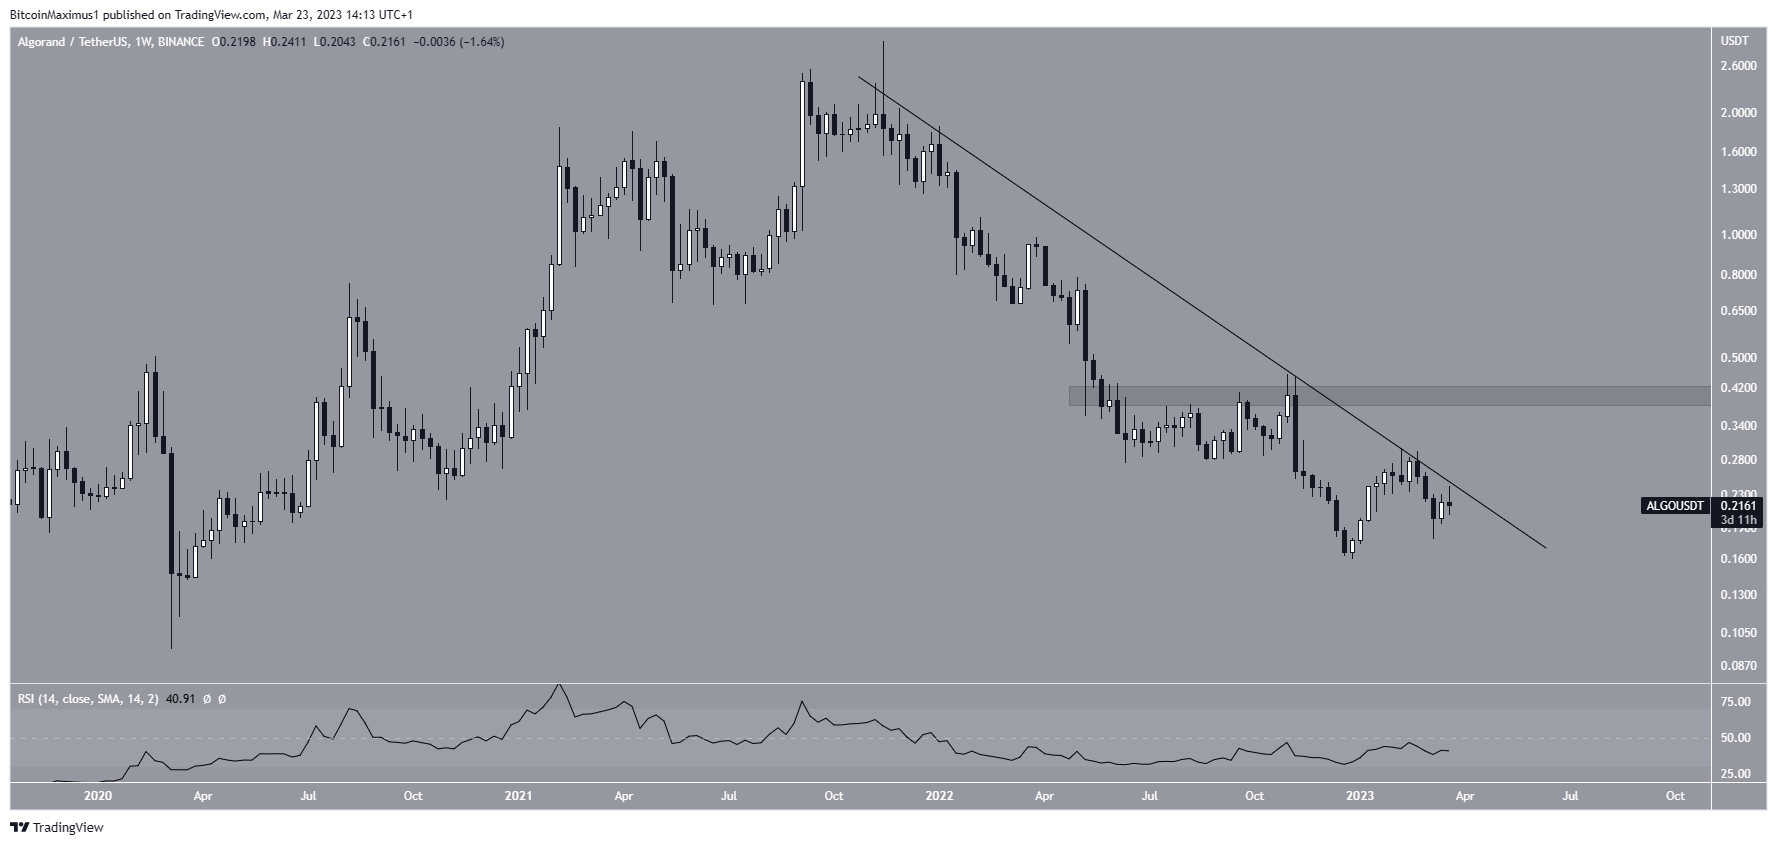
ALGO is the native cryptocurrency of the Algorand blockchain network. The weekly chart shows that the ALGO price has fallen since reaching an all-time high of $2.99 in November 2021. The decrease culminated with a low of $0.159 on Dec. 26.
While the price bounced afterward, it failed to break out from the resistance area. It is currently in the process of creating a higher low.
While the RSI is increasing, it is still below 50. As a result, it provides no direction for the future trend.
If the ALGO price breaks out, it could increase to the closest resistance area at $0.20. However, if it fails to do so, a retest of the $0.159 low could transpire.

Algorand (ALGO) Reaches Make-or-Break Level
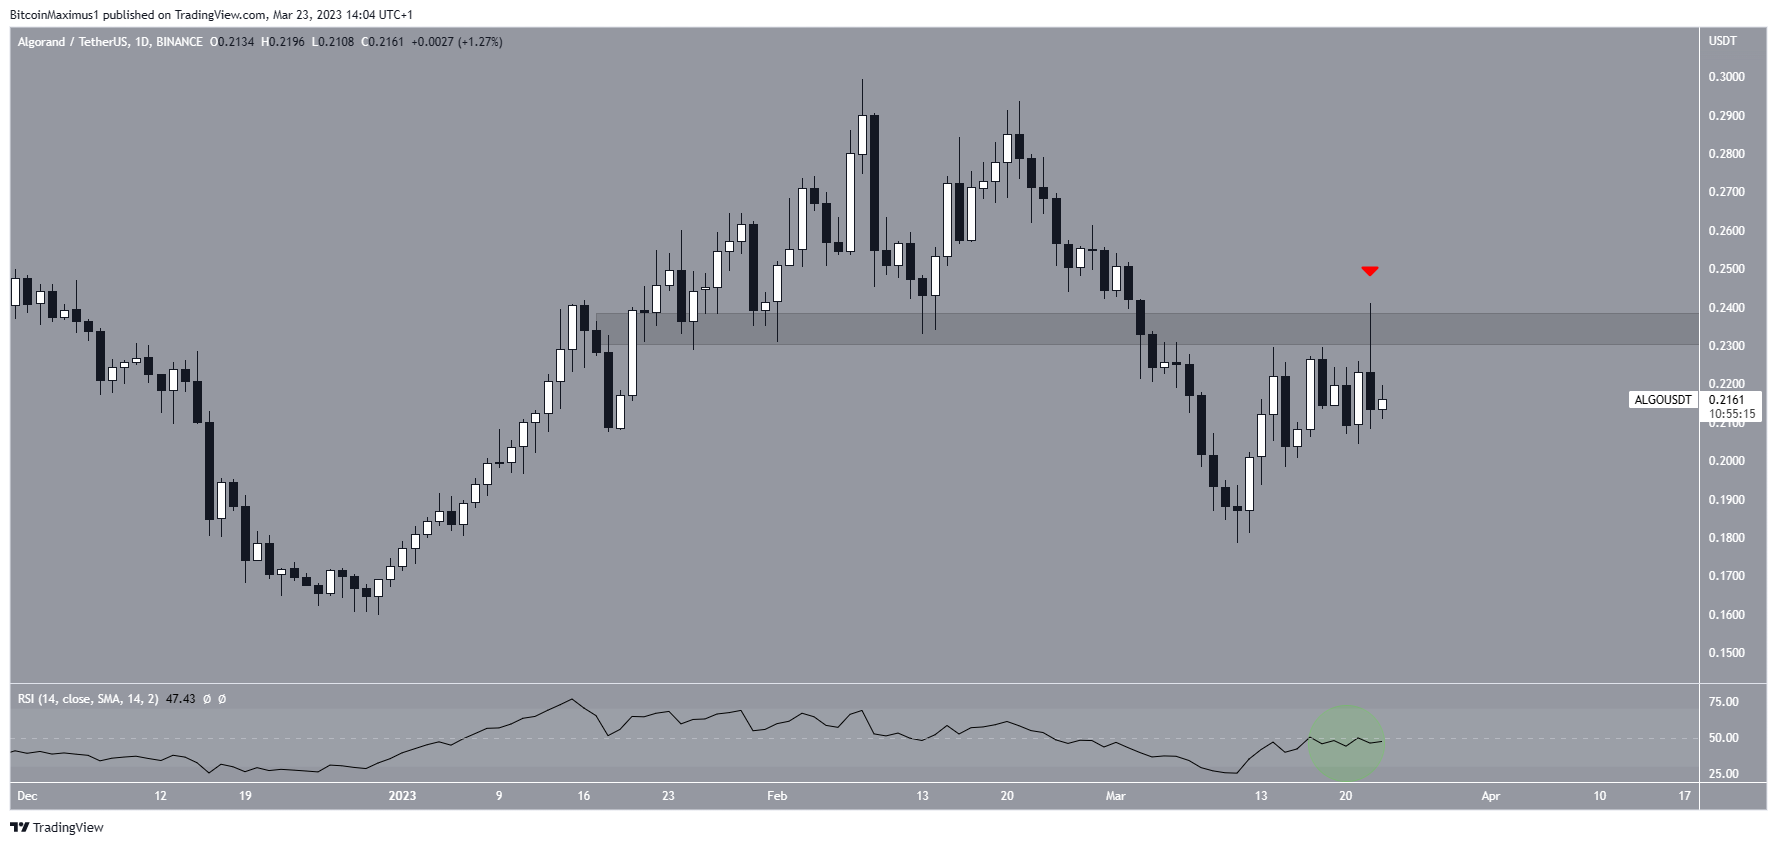
The technical analysis from the daily time frame shows that the Algorand price has fallen since creating a lower high on Feb. 21. While the price initiated a bounce on March 11, this culminated with a shooting star candlestick on March 22 (red icon) and a decrease over the next 24 hours. It also validated the $0.235 resistance area. Finally, the rejection coincided with an RSI rejection from the 50 line.
As a result, it is possible that the upward movement is complete and a drop will follow.

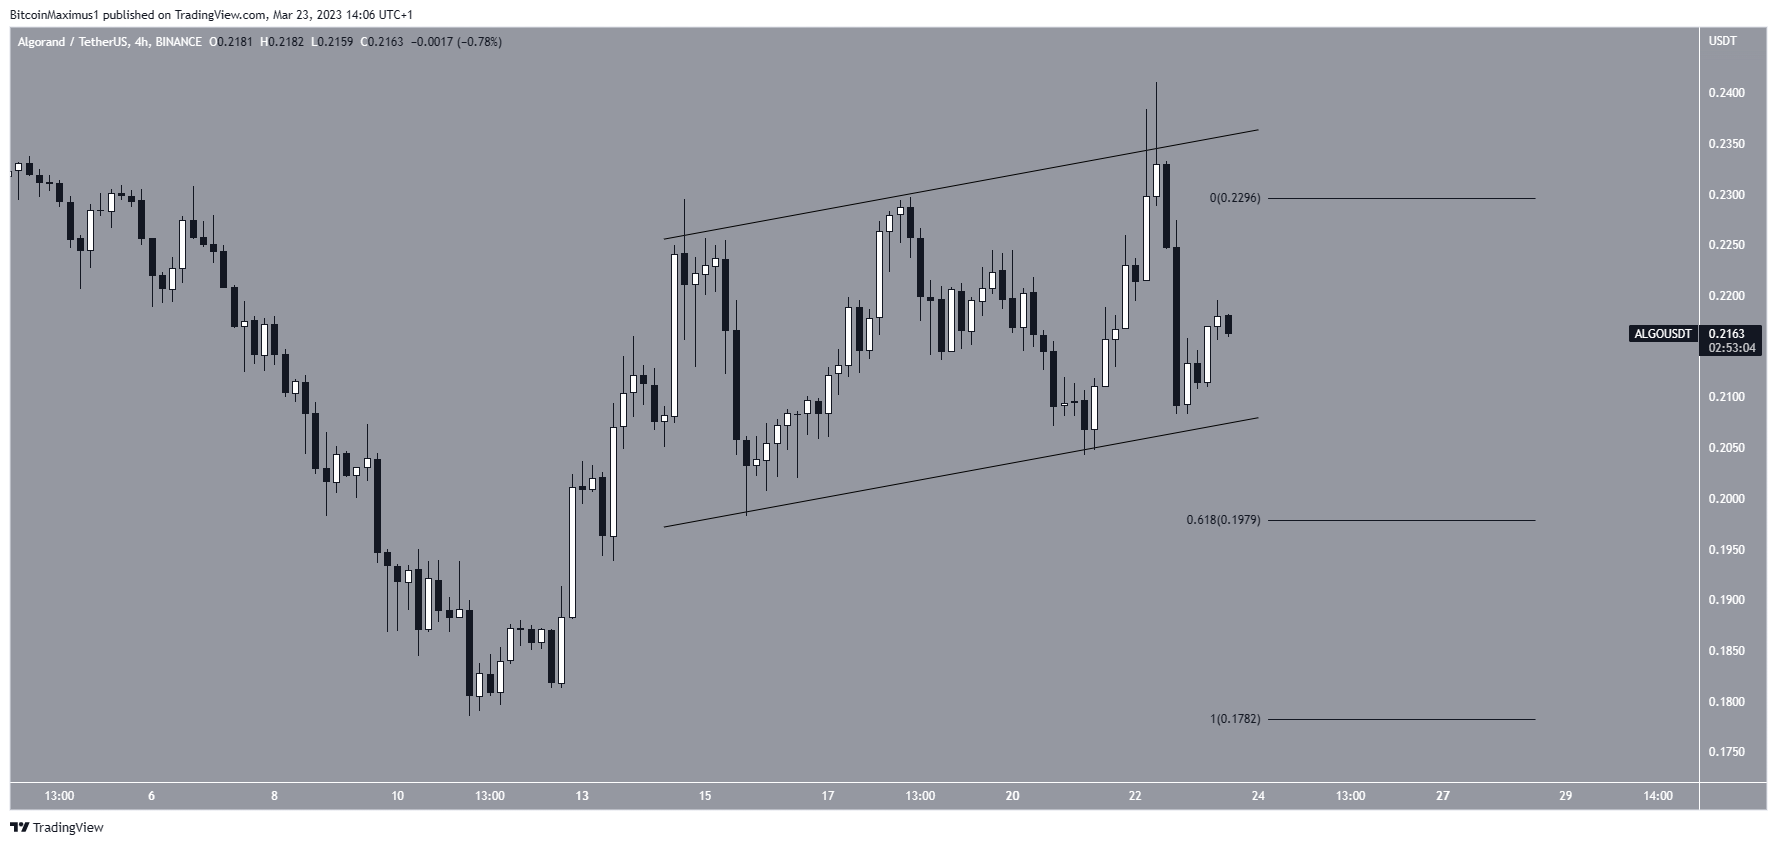
This possibility is also supported by the ascending parallel channel in the four-hour time frame. Such channels often contain corrective movements, meaning that a breakdown from it is expected.
In that case, the ALGO price could fall to the 0.618 Fib retracement support level at $0.198.
On the other hand, a breakout from the channel would invalidate this bearish forecast, indicating that the trend is bullish. In that case, the digital currency would also break out from the long-term resistance line. As a result, an increase to $0.40 could follow.

To conclude, there is a confluence of resistance levels between $0.23-$0.24, created by a short-term ascending parallel channel, a horizontal resistance area, and a long-term descending resistance line. Whether the price breaks out above this region or gets rejected could determine the future trend. A rejection would likely lead to a fall toward at least $0.198, while a breakout could lead to a 100% increase toward $0.40.
 beincrypto.com