BeInCrypto looks at the five biggest altcoins losers in the entire cryptocurrency market this week, specifically from March 3 to 10.
The altcoins that have fallen the most in the entire altcoin market are:
- Stacks ($STX) price fell by 32.71%
- SingularityNET (AGIX) price fell by 30.81%
- Mina ($MINA) price fell by 29.43%
- Render Token (RNDR) price fell by 28.77%
- Dash ($DASH) price fell by 24.98%
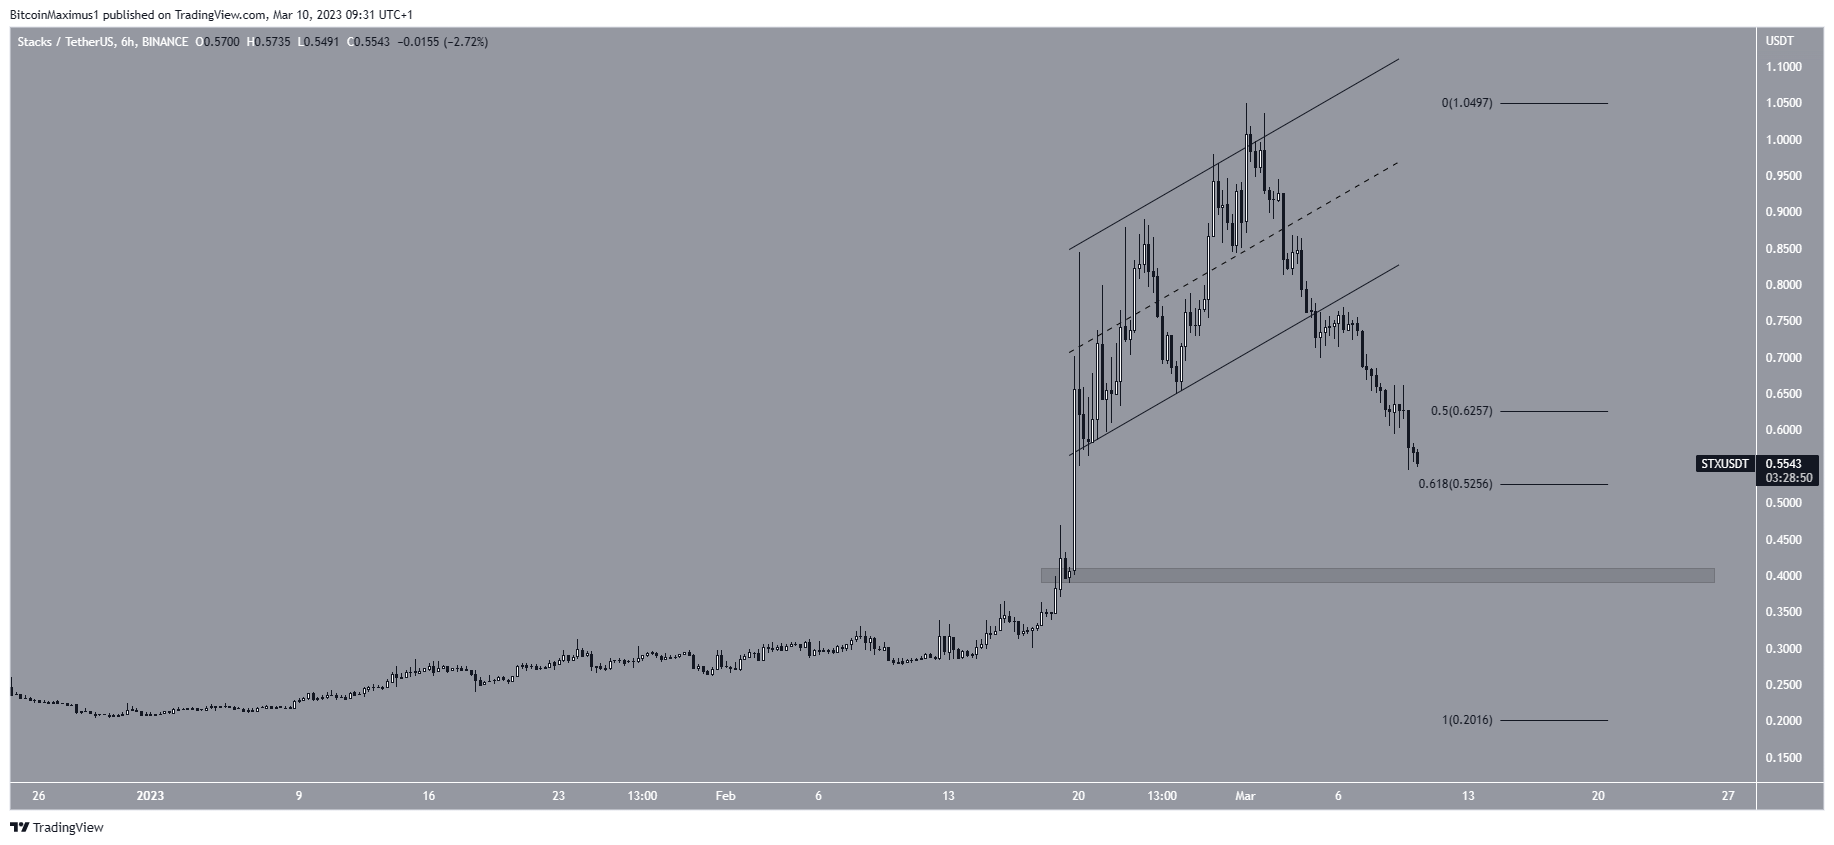
Stacks ($STX) Price Leads Crypto Market Losers
The Stacks price has decreased since reaching a high of $1.05 on March 1. The altcoin broke down from an ascending parallel channel on March 4, reaching a low of $0.59 on March 9.
Currently, the cryptocurrency price is trading just above the 0.618 Fib retracement support level at $0.53. While the area could initiate a bounce, the RSI has not generated any bullish divergence yet.
If the decrease continues, the next closest support area would be at $0.40. On the other hand, if a bounce occurs, the $STX price could increase to $0.63.
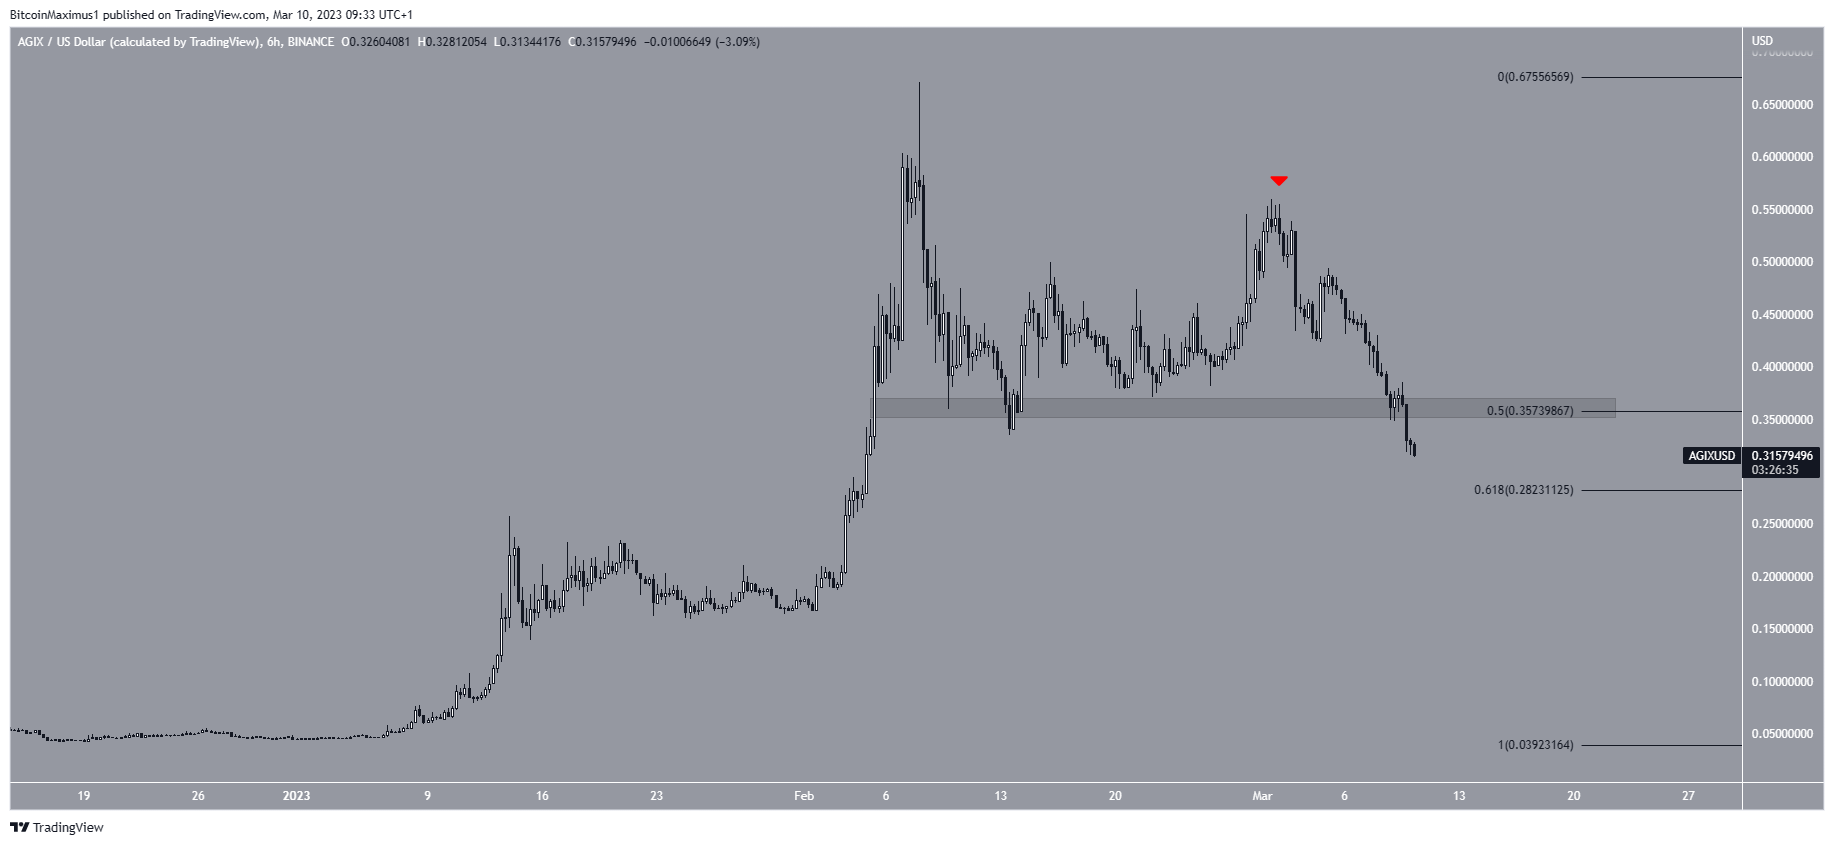
SingularityNET (AGIX) Price Risks Further Breakdown
The AGIX price has fallen since reaching a high of $0.67 on Feb. 8. It created a lower high (red icon) on March 1 and resumed its descent afterward. On March 9, it broke down from the 0.5 Fib retracement support level at $0.36.
If the decrease continues, the altcoin could fall to the 0.618 Fib retracement support level at $0.28.
However, AGIX could retest the $0.36 level if a bounce occurs.
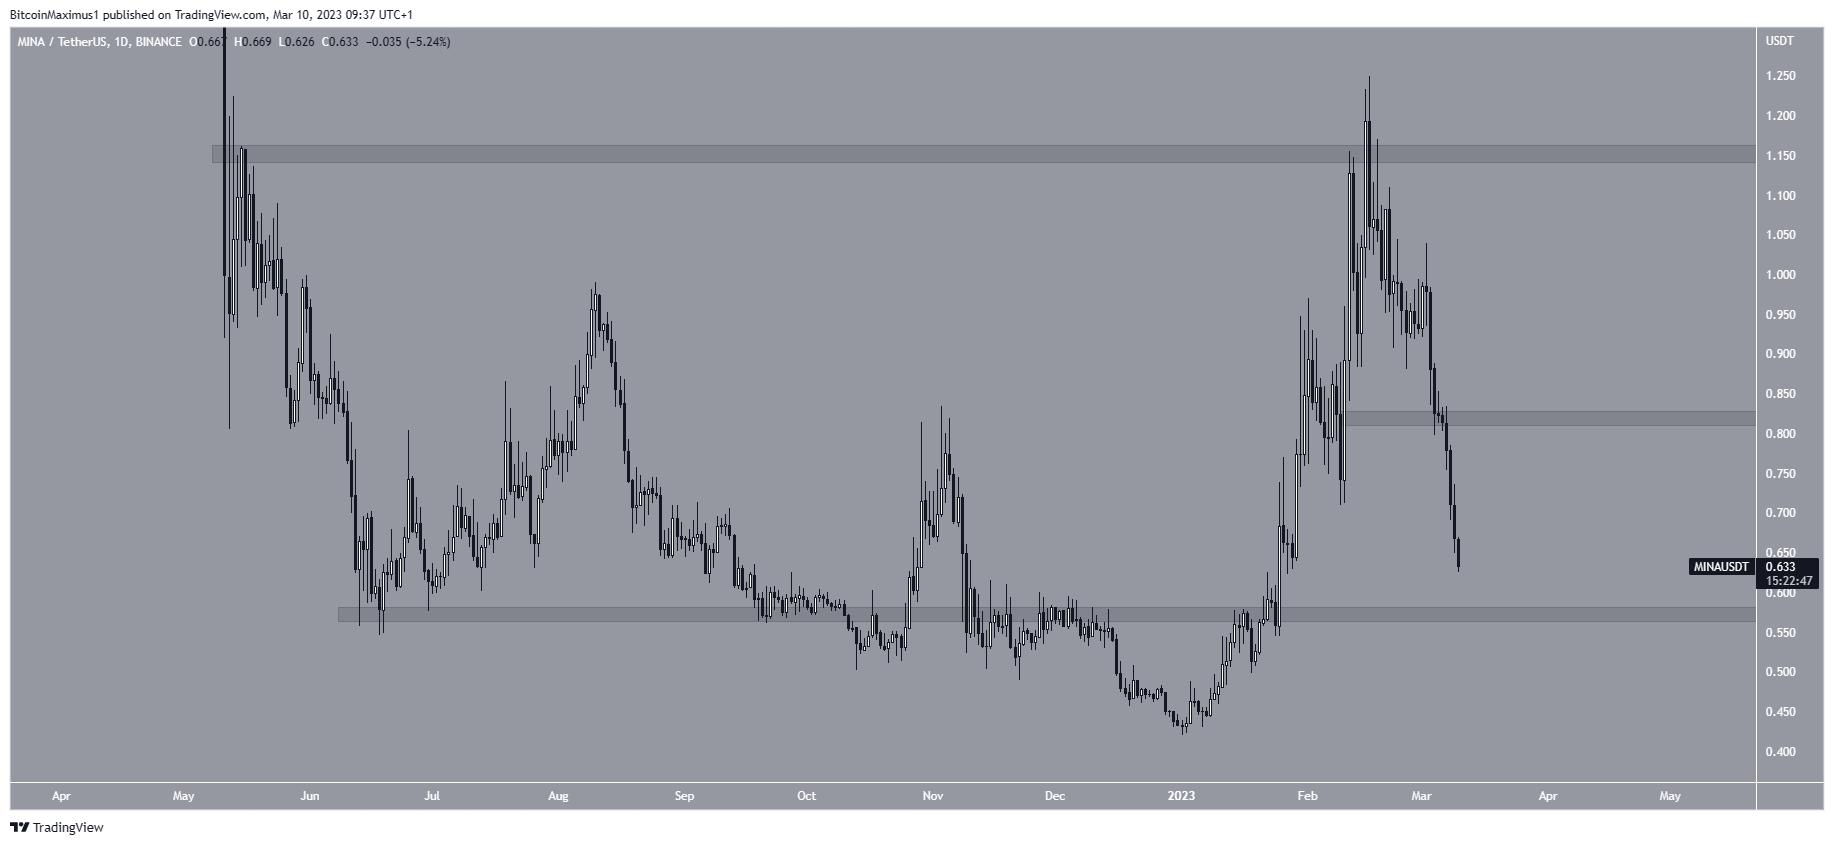
Mina ($MINA) Resumes Fall
The $MINA price has fallen sharply since reaching a high of $1.25 on Feb. 16. This caused a deviation above the $1.17 resistance area. The rate of decrease accelerated on March 3.
Currently, the crypto is approaching the $0.57 horizontal support area and is expected to reach it.
On the other hand, if the price bounces, it could retest the $0.82 area and validate it as resistance.
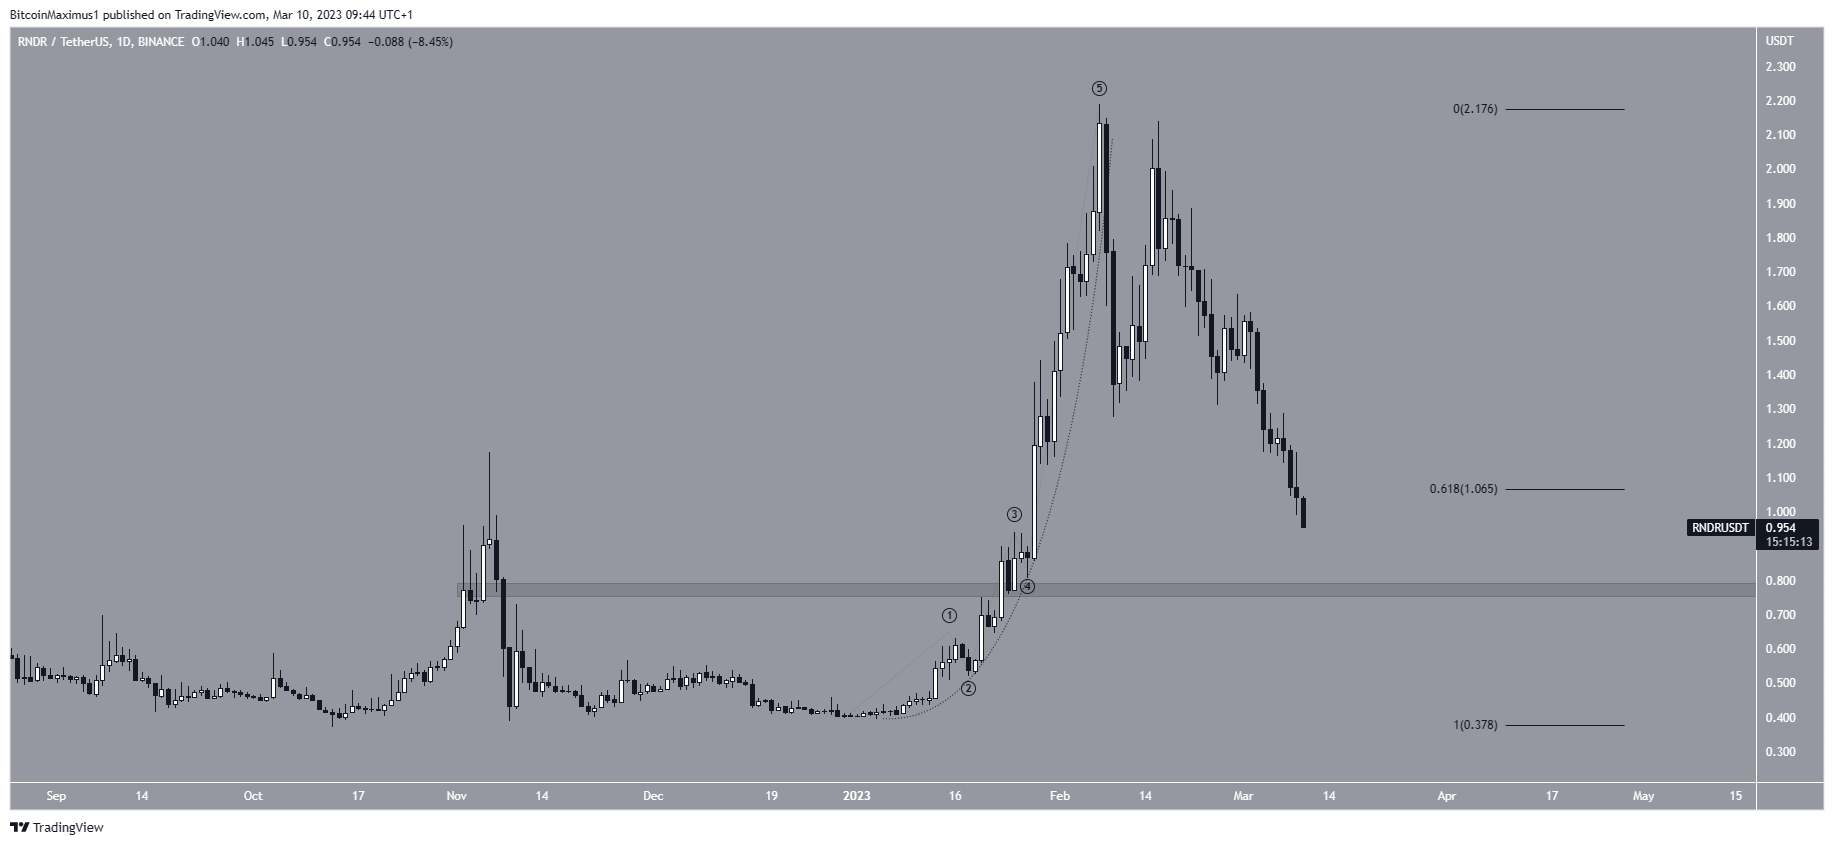
Render Token (RNDR) Falls After Parabola Breaks Down
The RNDR price has decreased since Feb. 7 when it reached a high of $2.19. It created a lower high on Feb. 16 and accelerated its rate of decrease afterward.
Currently, the digital asset trades below the 0.618 Fib retracement support level at $1.08. If the drop continues, the closest support would be at $0.77. On the other hand, if RNDR regains momentum, it could retest the $1.07 area once more.
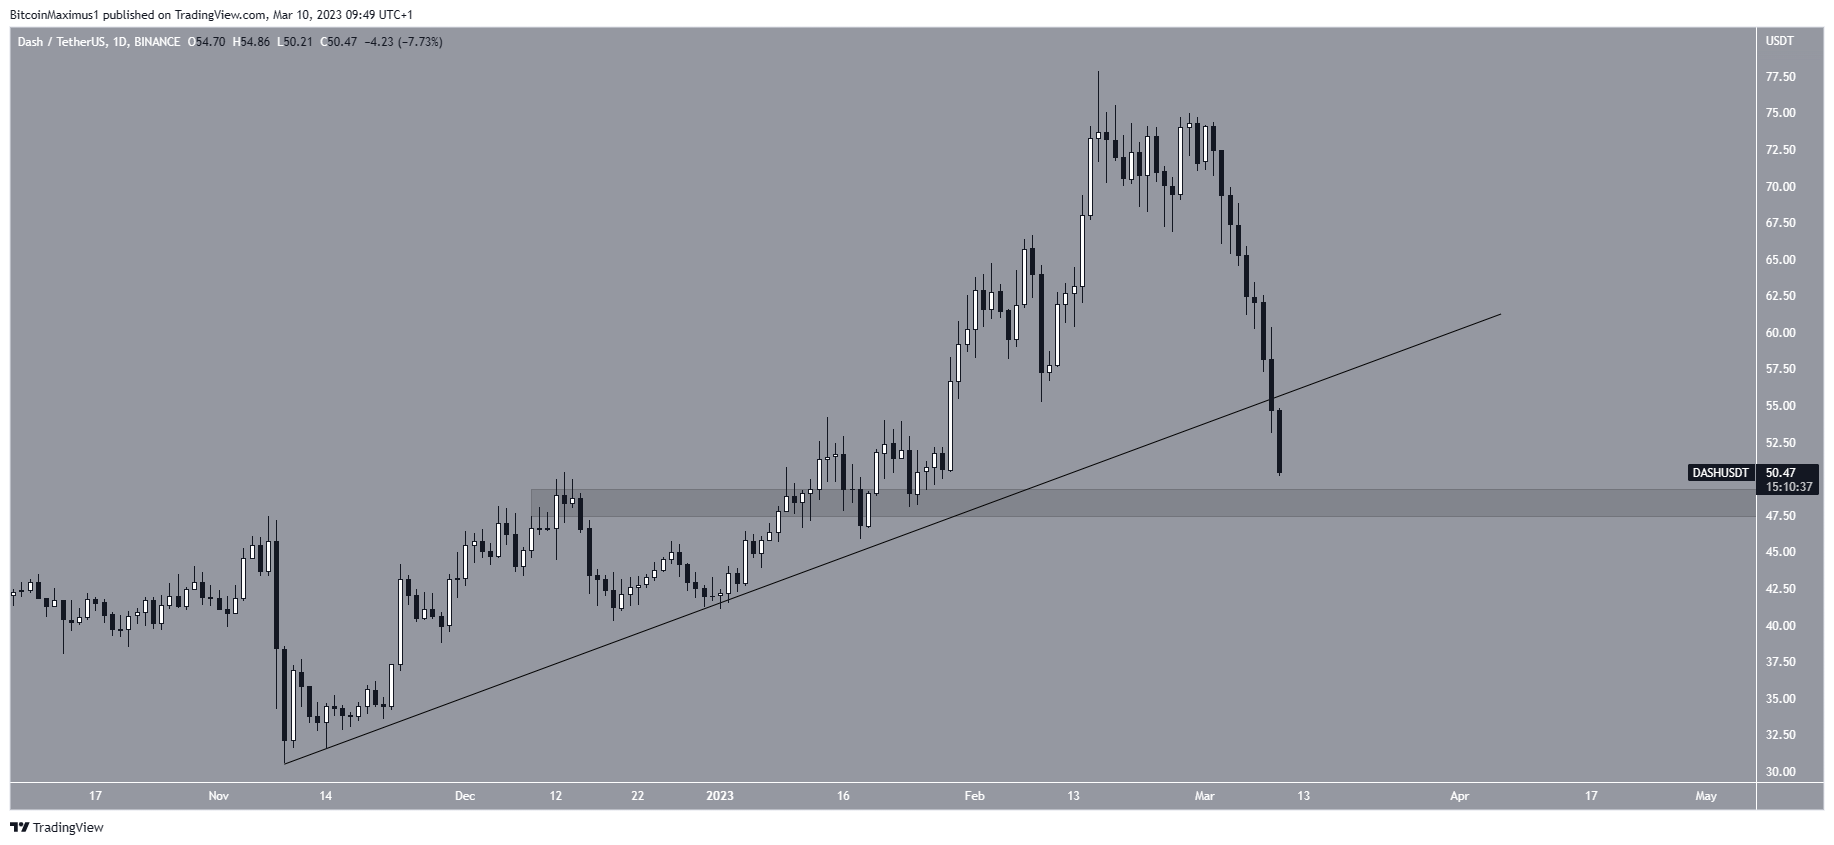
Dash ($DASH) Breaks Down From Ascending Support
The $DASH price has fallen since reaching a high of $77.90 on Feb. 16. The price created a lower high at the beginning of March and accelerated its rate of decrease afterward. On March 9, $DASH broke down from an ascending support line.
If the decrease continues, the closest support area would be at $49.
On the other hand, if the crypto asset regains momentum, it could retest the ascending support line at $60.